Introduction
Every trading day millions of posts, comments, and replies about individual stocks flood platforms like X (formerly Twitter), Stocktwits, Reddit and financial blogs. For most of market history, this outpouring of opinion was dismissed as noise, but it’s now one of the most closely watched alternative data sources on Wall Street.
This is because when sentiment around a stock shifts, either in message volume, tone, or both, prices tend to follow. This post explores the mechanics of daily social media sentiment measured against weekly, monthly, and longer-term sentiment averages as a predictor of next-day stock returns.
Signal Construction
Raw social media data is not a strong signal when compared cross-sectionally due to stocks consistently having different levels of attention and message volume. However, when benchmarked against a security's own prior social media behavior, it can provide meaningful insights. The raw metrics used at the security level in this analysis are:
Moving averages of both Raw-S and S-Volume are computed at 7-day, 28-day, and 182-day intervals, creating short-term, medium-term, and long-term baselines against which to compare daily readings.
For a security to be included in the portfolio, tweet volume must clear all three thresholds:
S-Volume > 7-Day Avg. S-Volume > 28-Day Avg. S-Volume > 182-Day Avg. S-Volume
This ensures tweet volume is meaningfully elevated above weekly, monthly, and semi-annual norms.
Sentiment must satisfy the following condition to qualify for either the Long or Short portfolio:
The logic mirrors classic price momentum. Just as a security breaking above its 7, 28, and 182-day price moving averages is viewed as exhibiting broad-based strength, a stock whose daily sentiment exceeds all three of its own sentiment moving averages is exhibiting broad-based opinion strength. The requirement that all three thresholds be crossed simultaneously is deliberate — it demands that sentiment be elevated relative to the stock's own near-, medium-, and long-term behavioral baselines.
Why Moving Averages of Sentiment Work
The intuition behind this framework draws from well-established momentum research. The tendency of recent winners to continue outperforming and recent losers to continue underperforming is one of the most replicated findings in finance. Sentiment momentum operates on the same principle: when public opinion around a stock is trending positive across multiple time horizons simultaneously, it suggests a durable shift in narrative.
The volume filter is not a trivial addition; it ensures sentiment readings are meaningful. By requiring volume to exceed all three moving averages, the strategy self-selects into periods of authentic social engagement.
Backtest Results
The strategy was backtested across a universe of US equities with a previous-day closing price above $5, capturing a broad cross-section of stocks with sufficient social media coverage.
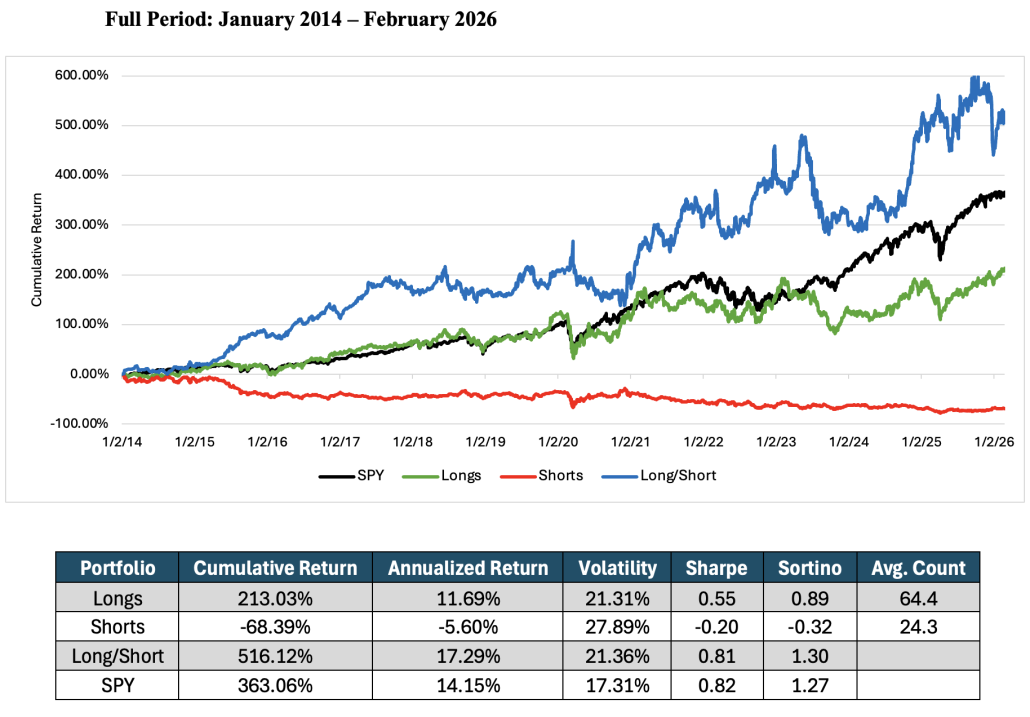
Over the full twelve-year backtest, the Long/Short portfolio compounded at 17.29% annualized, compared to 14.15% for SPY over the same period. The Long portfolio contributed 11.69% annualized while the Short portfolio added 5.60% annualized — a meaningful contribution that underscores the signal's bidirectional effectiveness. The strategy achieved a Sharpe ratio of 0.81 and a Sortino ratio of 1.30 on the Long/Short portfolio, with annualized volatility of 21.36%. The average portfolio composition of 64 long names and 24 short names reflects a concentrated but diversified set of high-conviction sentiment signals on any given day.
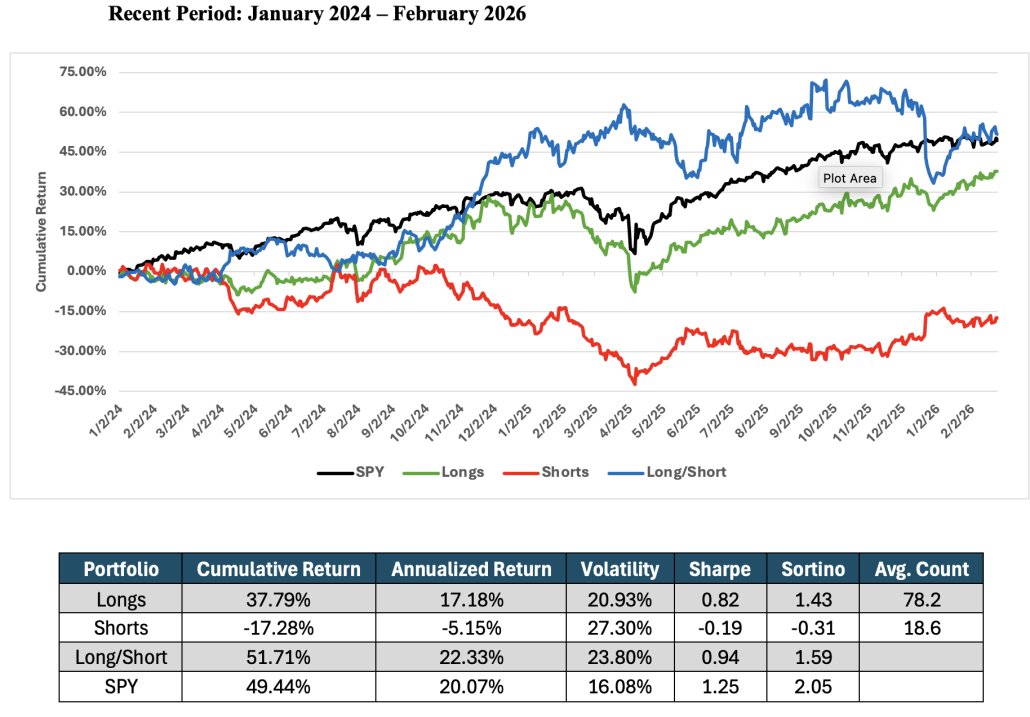
In the more recent two-year window, the strategy demonstrated similarly compelling behavior. The Long/Short portfolio delivered 22.33% annualized returns against SPY's 20.07%. The Long portfolio posted a cumulative return of 37.79%, while the Short portfolio posted -17.28%, which is consistent with the full-period findings.
The Short portfolio's consistency is particularly notable. Across both the two-year and twelve-year horizons, the short book posted negative cumulative returns, confirming that stocks experiencing sentiment deterioration across all three moving average horizons reliably underperform the following day.
Conclusion
The framework presented here, requiring that daily sentiment and message volume simultaneously exceed their 7-day, 28-day, and 182-day moving averages, offers a disciplined, rules-based approach to extracting signal from the social media data surrounding US equities
The backtest evidence spanning more than a decade is consistent. Stocks experiencing a durable break above their own historical baselines across multiple time horizons, tend to outperform on the following day. The short-side evidence is equally compelling, with sentiment deterioration across all three horizons reliably predicting underperformance.
In a world where every market participant has access to the same price data and financial statements, the edge increasingly lies in extracting structured signal from unstructured data. Sentiment momentum — measuring today's opinion against a stock's own sentiment history — is one intuitive way to do exactly that.