Abstract
This study investigates the ability of social media sentiment to predict short-term movements in equity prices. Using proprietary sentiment metrics developed by Context Analytics (CA), specifically the S-Score, we evaluate whether extreme sentiment levels correspond to abnormal equity returns. This research aims to demonstrate the relationship between S-Score prior to market close and the subsequent close-to-close period return.
1. Introduction
Social media platforms, particularly Twitter, have become a significant source of real-time information and market sentiment. The aggregation and quantification of these messages can offer predictive insights into investor behavior and price movements. CA has developed a suite of proprietary sentiment metrics, named “S-Factors”, designed to capture and quantify such information. Among these, the S-Score serves as the core sentiment indicator, representing the statistical deviation of current social media sentiment from its historical norm.
Context Analytics employs topic models for each individual security within its universe. Each topic model comprises a structured set of linguistic and entity-based identification rules that enable the system to accurately determine which social media messages pertain to a given firm. When a message satisfies any of the topic model’s predefined rules, it is ingested and evaluated for sentiment scoring.
Each message is assigned a sentiment score on a continuous scale ranging from –1.0000 to +1.0000, where negative values indicate pessimistic sentiment, positive values indicate optimistic sentiment, and values near zero indicate neutral sentiment. Both the sentiment values and the message volumes are then aggregated over a rolling 24-hour period by security. These aggregated values are subsequently compared against a 20-day historical baseline, forming the foundation for the proprietary S-Factors developed by Context Analytics. All S-Factors are updated at one-minute intervals, ensuring high-frequency responsiveness to evolving market sentiment.
The S-Score is computed as an exponentially weighted summation of the sentiment values associated with messages referencing a given security over the preceding 24 hours. The 24-hour exponentially weighted aggregate sentiment (S) is normalized by subtracting the 20-day mean sentiment (S-Mean) and dividing by the corresponding sentiment standard deviation (S-Volatility):
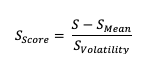
The exponential weighting scheme assigns greater significance to recent messages, such that sentiment expressed minutes ago exerts a stronger influence than sentiment expressed several hours earlier. This design enables the S-Score to capture real-time shifts in market perception, while controlling for variations in message volume and historical sentiment levels. Consequently, the S-Score provides a cross-sectional and time-sensitive measure of social sentiment that can be directly compared across securities without bias toward message frequency.
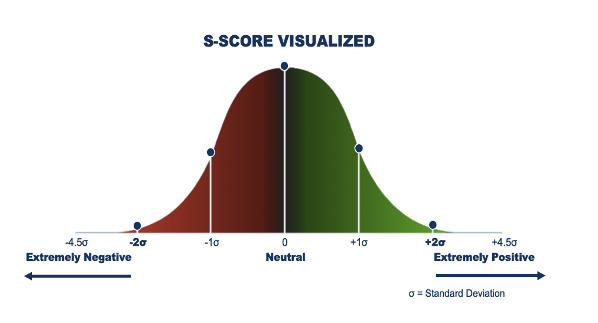
An S-Score of +2.0 implies the current sentiment is two standard deviations more positive than the security’s historical mean. Conversely, an S-Score of -2.0 represents unusually negative sentiment. The hypothesis is that securities exhibiting extremely positive sentiment should outperform the market, while those with extremely negative sentiment should underperform.
2. Methodology
2.1 Data and Universe
The CA universe contains over 4,500 active US Equities. For this research we will only evaluate securities with a Price > $5 to exclude drastic returns from penny stocks. End of day pricing data is used as well as pre-market close Sentiment values.
2.2 Experimental Design
This analysis adopts a close-to-close trading strategy. Before market close, at 3:40pm ET, we grab all US Equities with a S-Score published. These securities are bucketed into daily quintiles based on the value of S-Score. Each day the highest 20% of S-Scores are grouped in quintile 5, the next highest 20% in quintile 4, and so on until the bottom 20% of S-Score are in quintile 1. We then calculate the close-to-close return of each individual stock and equally average the return by quintile to have a daily portfolio return for each quintile. Daily quintile returns are cumulated over time to provide an isolated view of the relationship between S-Score and subsequent daily return. Below is the plot of the cumulative return of these quintiles over the last 10+ years using data sourced from Twitter.
3. Results
3.1 Quintile Performance
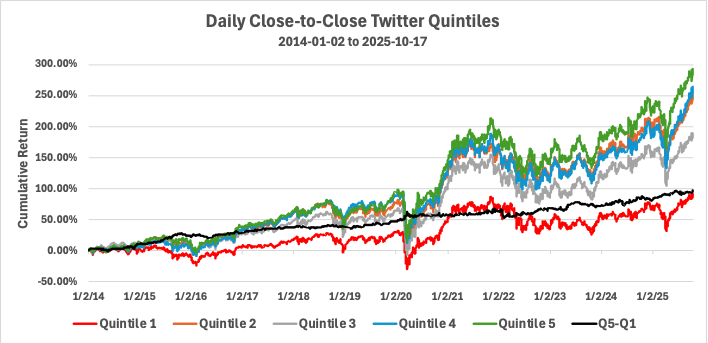
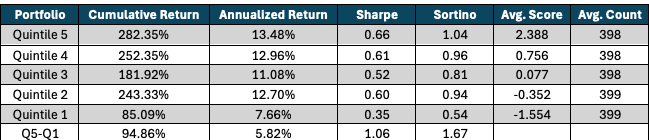
The quintile analysis presented in the figure above illustrates a systematic relationship between S-Score levels and subsequent daily close-to-close equity returns. Securities were sorted into quintiles based on their pre-close S-Scores, with Quintile 1 representing the lowest (most negative) sentiment and Quintile 5 representing the highest (most positive) sentiment derived from Twitter messages. A clear trend emerges; securities with higher S-Scores tend to outperform, while those with lower S-Scores underperform during the following trading session. The spread in average returns between Quintile 5 and Quintile 1 is both economically and statistically significant, supporting the hypothesis that extreme social media sentiment contains predictive information regarding short-term price movements.
Furthermore, the performance spread between these quintiles supports the construction of a Long–Short portfolio strategy, in which securities in Quintile 5 are bought and those in Quintile 1 are shorted. This strategy yields a Sharpe ratio of 1.06, indicating a favorable risk-adjusted return profile and consistent performance across the sample period. On average, the analysis incorporates data from nearly 2,000 securities per day, ensuring robust cross-sectional representation and minimizing idiosyncratic effects.
3.2 Incorporating SV-Score: Twitter Volume Normalization
The SV-Score represents a standardized measure of Twitter message volume for each security. It quantifies the relative intensity of social media activity over the preceding 24-hour period, normalized against the security’s own historical baseline. The SV-Score is constructed using the same statistical framework as the S-Score, expressed as a Z-Score relative to the 20-day mean and standard deviation of historical message counts.
Accordingly, an elevated SV-Score indicates a higher-than-typical level of online discussion surrounding a company, while lower values reflect diminished social activity.
The incorporation of the SV-Score enables the evaluation of whether abnormal social media volume enhances or moderates the relationship between sentiment (S-Score) and subsequent equity returns. In this study, we examine how varying thresholds of SV-Score intensity influence the predictive efficacy of S-Score trading signals.
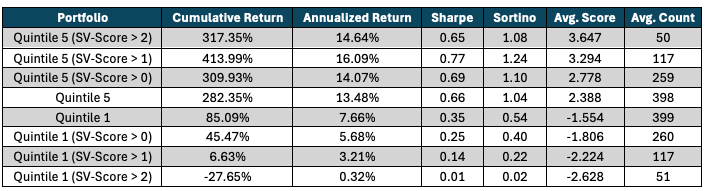
To assess the interaction between sentiment and message volume, we compare baseline S-Score extreme quintile portfolios (Quintile 1 & 5) with those filtered by increasing levels of social volume activity. Specifically, we analyze portfolios that include only securities meeting the following SV-Score thresholds:
For each portfolio, we use the same methodology as the strategy above. All sentiment scores are taken 3:40pm ET with returns calculated from the subsequent close-to-close period.
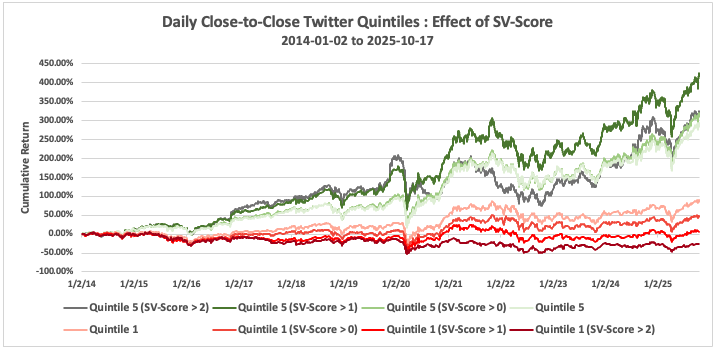
The findings from the 10+ year period demonstrate a pronounced interaction between social media message volume (SV-Score) and sentiment (S-Score). Specifically, the results indicate that abnormal Twitter activity amplifies the predictive power of sentiment signals, particularly on the negative side of the sentiment spectrum.
As the SV-Score threshold increases, the underperformance associated with the lowest sentiment quintile becomes markedly more severe. Securities in Quintile 1 with SV-Score > 2—representing extremely negative sentiment coinciding with unusually high social media attention—exhibited a cumulative loss of approximately 27% over the sample period.
Moreover, as the SV-Score threshold decreases, this negative return effect diminishes, indicating that volume acts as a magnifier of sentiment strength. Thus, extreme negativity in low-volume environments carries less predictive power compared to similar sentiment under high-volume conditions.
A similar, though less pronounced, pattern emerges for the most positive sentiment quintile. Securities in Quintile 5 display improved performance when filtered by elevated SV-Score thresholds, confirming that abnormal message volume also enhances the positive predictive signal. However, this relationship exhibits non-monotonic behavior: portfolios filtered at SV-Score > 1 outperform those at SV-Score > 2, suggesting potential diminishing returns when social media activity reaches extreme levels.
3.3 Long-Short Strategy
Building on the preceding analyses, a Long-Short trading strategy was constructed to evaluate the joint predictive power of S-Score and SV-Score. Prior findings established that securities exhibiting extreme sentiment tend to experience subsequent returns in the same direction, while the inclusion of the SV-Score as a volume filter enhances both stock selection and portfolio performance.
In this strategy two portfolios were formed daily based on the following criteria:
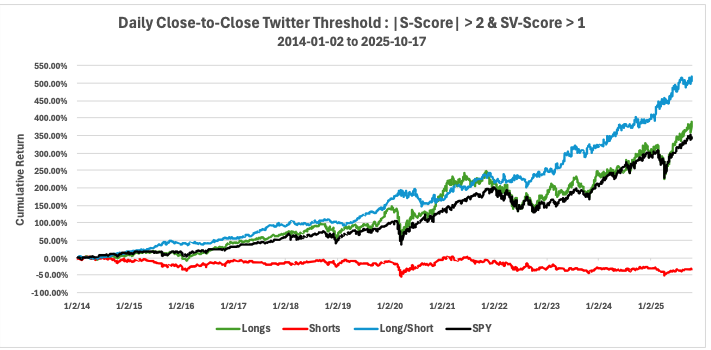
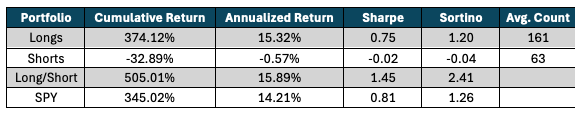
The Long/Short portfolio achieved a cumulative return exceeding 500% over the sample period, substantially outperforming the SPY benchmark. While the risk-adjusted performance metrics also suggest a highly favorable risk profile. The strategy exhibits persistent alpha generation throughout the 10-year backtest, suggesting robustness across varying market regimes. The results confirm that combining high sentiment intensity with abnormally high social media volume identifies securities likely to outperform the market, while the short side effectively captures securities like to underperform.
4. Conclusion
This study provides empirical evidence that social media sentiment, as quantified by CA’s S-Scores, contains predictive information about short-term stock returns. A simple close-to-close trading strategy based on statistically significant S-Scores generated substantial excess returns relative to the market benchmark. Securities experiencing abnormally positive online discussion tend to generate higher returns, while those facing strong negative sentiment tend to decline. Furthermore, abnormal Twitter activity amplifies the predictive power of the extreme sentiment signals. These results support that properly quantified social media sentiment represents a valuable alternative data signal for short-term equity prediction.