Context Analytics previously published a research note asking a simple question: can changes in SEC filings predict U.S. equity returns? The idea traces back to “Lazy Prices” (Cohen, Malloy, and Nguyen, 2019), which found that firms making substantial changes to their quarterly and annual reports tend to underperform, while firms whose filings stay largely the same tend to outperform. The rationale is intuitive. Regulatory filings are long, repetitive documents that most market participants do not read closely or entirely. When management does make material revisions in response to changing conditions or new risks, information works its way into prices gradually.
Our original analysis, built on the Machine Readable Filings (MRF) dataset developed with S&P Global Market Intelligence, confirmed the effect. This post updates that work with nearly two decades of data and focuses on a single factor we use as a proxy for document similarity:
Magnitude % Change in Word Count = | Percent Change in Word Count |
Expressing the change in percentage terms, rather than as a raw word-count difference, normalizes the signal across documents of varying lengths. A 2,000-word change means something very different in a 10,000-word filing than in a 100,000-word one. Taking the absolute value strips out direction: a document that grew 20% and one that shrank 20% both score 0.20. The factor measures how much a filing changed.
The MRF dataset parses SEC EDGAR filings (10-Ks, 10-Qs, 8-Ks, 20-Fs, and others) into a machine-readable JSON format with word counts at the document, part, and item level. For this analysis we use total document word count for 10-Ks and 10-Qs, comparing each filing to the company’s most recent prior filing of the same type.
Portfolio construction follows a standard calendar-time approach:
We test two universes, both restricted to stocks trading above $5:
The large-cap universe doubles as a robustness check. Filings-based anomalies are often assumed to live in small, thinly covered names. If the signal still works among the most heavily analyzed companies in the market, it can’t be dismissed as a small-cap anomaly.
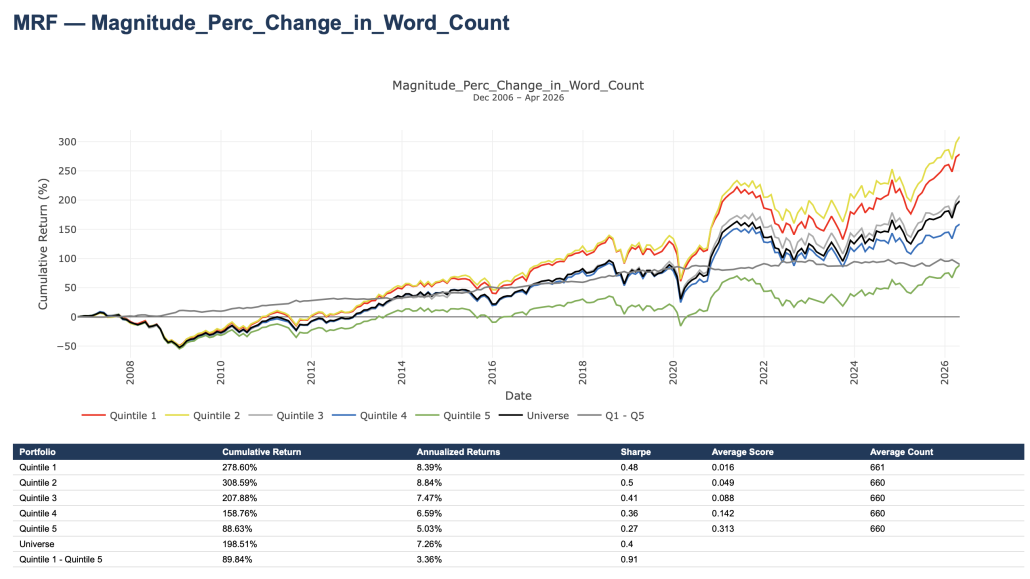
Returns fall nearly monotonically across quintiles. The low-change quintiles (Q1 and Q2, where the typical document changed by less than 5%) beat the universe on both a raw and risk-adjusted basis. Quintile 5, where the average filing changed by roughly 31%, produced less than a third of Q1’s cumulative return, along with the lowest Sharpe ratio of any bucket. A long-short portfolio — long Q1, short Q5 — returned 89.8% cumulatively, or about 3.4% a year, with a Sharpe ratio of 0.91. The spread having a higher Sharpe than any individual quintile reflects how consistently the ordering holds over time.
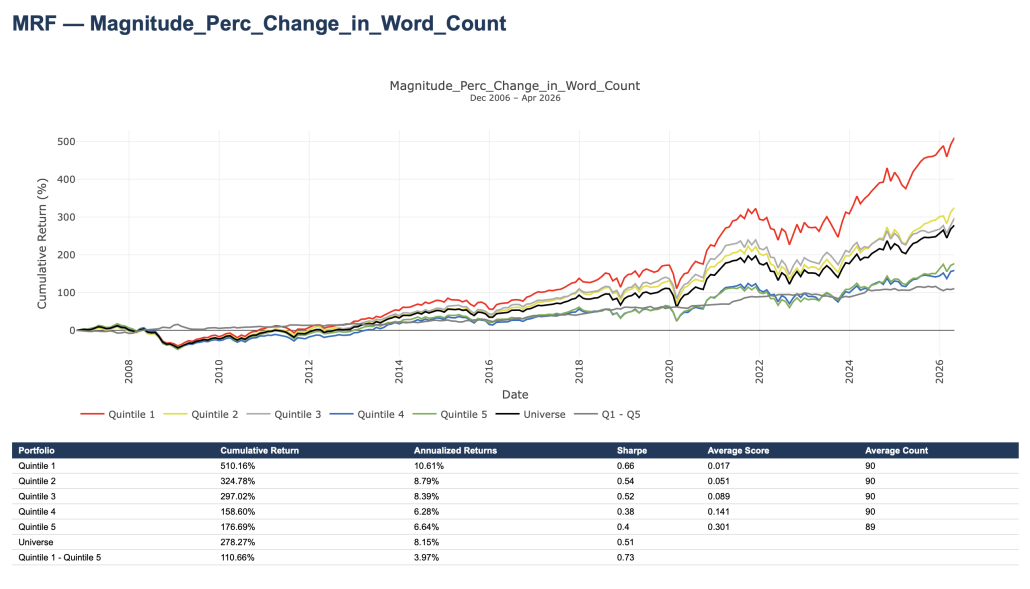
The effect is also evident among large caps. Quintile 1 returned 510% cumulatively — nearly double the large-cap universe and roughly three times the high-change bucket. The Q1−Q5 long-short portfolio earned about 4.0% a year (110.7% cumulative) at a Sharpe of 0.73 — a wider spread than in the broad universe, though somewhat less steady given the smaller number of names.
With only ~90 companies per quintile, individual names carry more weight in each bucket’s return. It doesn’t change the takeaway. The low-change quintile outperforms decisively in both universes, and the effect does not fade as market capitalization increases.
These results extend our earlier finding that companies making large changes to their regulatory filings underperform their peers, while companies making few changes tend to outperform. The large-cap results also answer a common objection to filings-based signals which is anything disclosed by a heavily covered name is already baked into the price. This suggests otherwise.
The economic interpretation is consistent with the original literature. Substantial rewrites of a 10-K or 10-Q are rarely discretionary. They usually reflect new disclosures management is obligated to make, and those disclosures tend to carry uncertainty. Measuring the magnitude of change captures a meaningful share of that information content without any sentiment analysis.
The analysis here uses total document word count only. Because the MRF dataset breaks filings down to the part and item level, the same construction can be run on individual sections such as Management Discussion & Analysis and Risk Factors sections. This is a topic that will be explored in further blogs.
Learn more about how Context Analytics powers next-generation investment research at www.contextanalytics-ai.com.
Data: CA Machine Readable Filings, built on S&P Global Market Intelligence textual data from SEC EDGAR.
Reference: Cohen, L., Malloy, C., & Nguyen, Q. (2019). “Lazy Prices.” SSRN.