Context Analytics (CA) is proud to announce an expansion in social sentiment global security coverage to include Japanese securities (JPX). Japan is the second-largest Twitter/X user base in the world, providing a rich pool of social conversation around Japanese companies. CA’s JPX dataset retrieves textual data from Twitter messages, both English and Japanese textual data, and generates sentiment scores using our proprietary Natural Language Processing (NLP) technology. These sentiment scores are actionable factors that reflect both the tone and volume of conversations at the security level. One of CA’s flagship products, the S-Factor feed, features the S-Score—a metric that quantifies the positivity or negativity of sentiment for each security.
Japan is a market in which this type of data has substantial room to add value. This research note addresses whether those companies are discussed on social media at all, and whether that discussion carries information about subsequent price movements.
The JPX history begins January 1st, 2024, spanning approximately two and a half years. The dataset tracks over 3,500 securities, with ~1,990 securities generating a daily signal. Sentiment is generated from textual data on English and Japanese messages using live translation.
| Dataset characteristic | JPX (Twitter) |
| History | Jan 1 2024 – Jul 31 2026 |
| Securities tracked (total) | 3,593 |
| Securities with a daily sentiment signal (average) | 1,989 |
| Total message volume per trading day (average) | 7,217 |
Table 1. JPX Twitter sentiment dataset (daily snapshot at 15:10 JST). Averages are computed across JPX trading days only.
Sentiment Factors (S-Factors) are updated and distributed every minute. All results presented in this research note are based on sentiment from the daily snapshot taken at 15:10 JST, which supports trading over daily horizons from market close to the next day’s market close.
The file also carries observations on non-trading days, since discussion of Japanese equities continues through weekends and market holidays.
Each security-day carries a full set of S-Factors, including raw sentiment and its normalized counterpart, trailing means and volatilities for both, message volume and its normalized equivalent, and the S-Dispersion, S-Buzz and S-Delta factors. The primary factor used throughout this research note is the S-Score, a Z-Score that detects sentiment from Twitter. An S-Score greater than 2 indicates that the conversation over the last 24 hours is 2 standard deviations more positive than the previous 20 days, suggesting a bullish outlook for the stock price. Conversely, a more negative S-Score reflects negative sentiment and a bearish outlook.
The practical implication of this construction is that a security does not register as bullish because sentiment toward it is favorable in absolute terms, but because sentiment is more favorable than is typical for that security. This self-referencing normalization allows a mid-capitalization Japanese company to be compared directly with a mega-cap company in a cross-sectional sort.
To demonstrate the relationship between S-Score and future price returns, we grouped securities into daily quintiles and plotted the cumulative price return. At 15:10 JST we take all securities with an S-Score published that day. These securities are bucketed into daily quintiles based on the value of their S-Score: each day the highest 20% of S-Scores are grouped in Quintile 5, the next highest 20% in Quintile 4, and so on until the bottom 20% of S-Scores are in Quintile 1. We then calculate the close-to-close return of each individual stock, equally average the return by quintile and day, and compound the daily series to generate a portfolio of cumulative returns by quintile.
In more detail, on each trading day and independently of every other day:
The process is run twice. The first pass uses every security with a published S-Score and a valid close-to-close return. The second applies a liquidity screen, under which a security must have a trailing 10-day average volume of at least 500,000 shares, lagged one day so that no look-ahead is introduced by the screen itself. The screen reduces the universe to approximately one quarter of its original size and represents the tradable specification of the strategy.
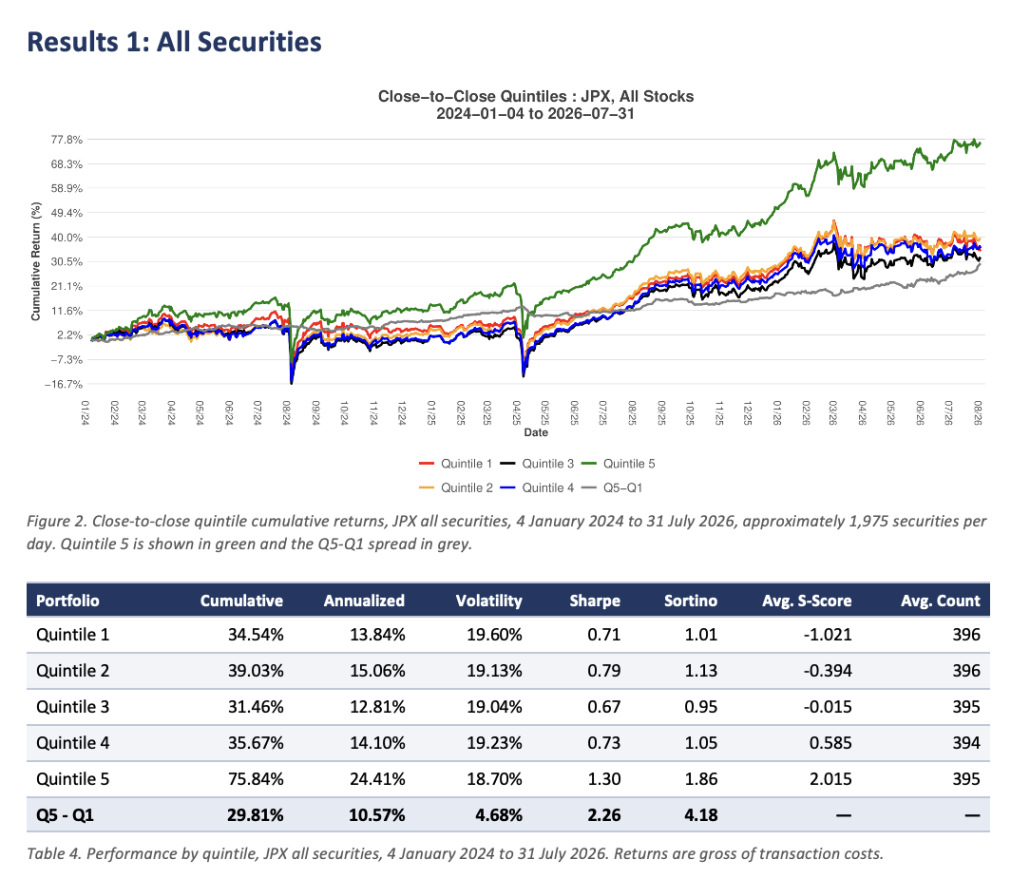
The chart above demonstrates that the S-Score carries information in the Japanese market, though the relationship is not uniformly monotonic across quintiles. Quintiles 1 through 4 are effectively indistinguishable from one another. Substantially all of the separation occurs in the top bucket. Quintile 5, containing the most positive S-Scores, compounds 75.84% over the period for an annualized return of 24.41%, against cumulative returns of 31% to 39% for the remaining quintiles, and does so at marginally lower volatility, producing a Sharpe ratio of 1.30 against approximately 0.72 for the other four portfolios.
The signal is therefore better characterized as a means of identifying securities toward which sentiment has turned unusually positive than as a complete cross-sectional ranking of the market.
The long/short spread is of particular interest from a portfolio construction perspective. The Q5-Q1 spread compounds 29.81% at an annualized volatility of only 4.68%, approximately one quarter of the volatility of any individual quintile, because the spread nets out substantially all Japanese market beta. This produces a Sharpe ratio of 2.26 and a Sortino ratio of 4.18. The spread was positive on 58.7% of trading days and in 24 of the 31 months in the sample.
Applying the 500,000-share liquidity screen reduces the universe to approximately 485 securities per day, or roughly 97 per quintile. This specification is the more relevant of the two for implementation.
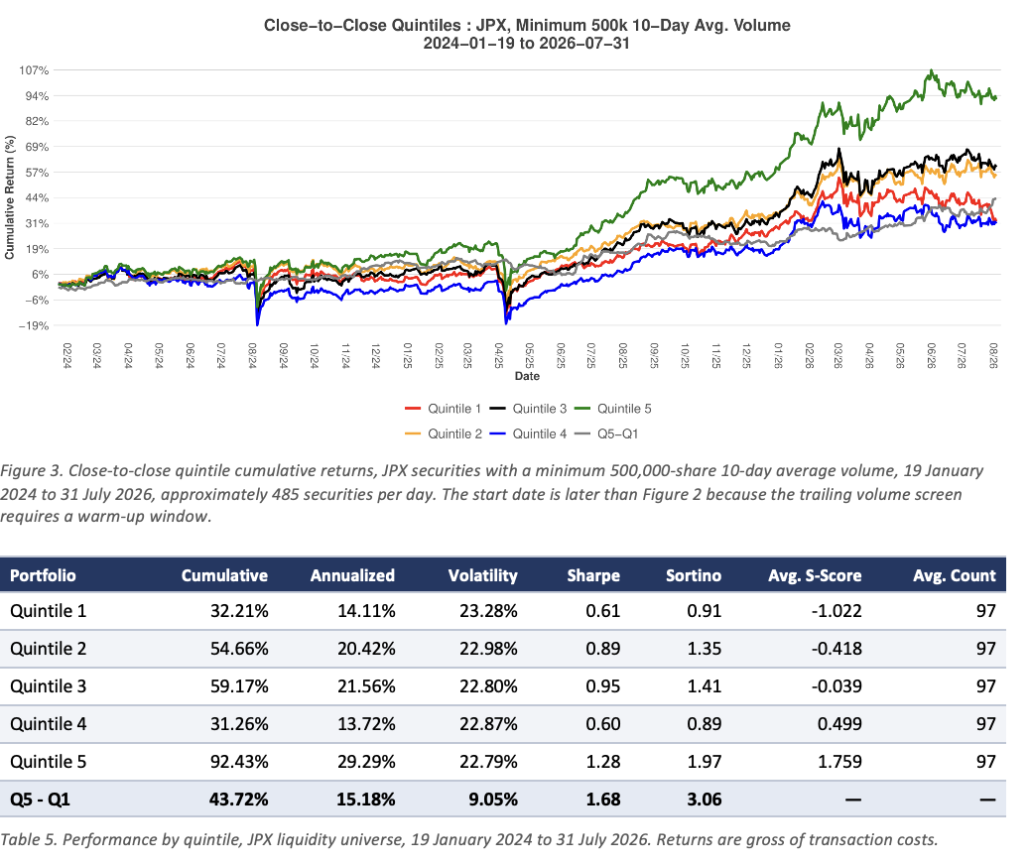
Liquid securities produce a wider dispersion of outcomes. Quintile 5 compounds 92.43% for an annualized return of 29.29%, against 32.21% cumulative and 14.11% annualized for Quintile 1. The annualized spread widens from 10.57% in the full universe to 15.18%, approximately 50% more gross alpha once the universe is restricted to securities in which an investor can transact meaningful size.
The offsetting consideration is diversification. Each leg is spread across approximately 97 securities rather than approximately 395, so the volatility of the spread roughly doubles, and the Sharpe ratio declines from 2.26 to 1.68. The proportion of positive days falls to 54.1% and positive months to 20 of 31. This constitutes a genuine portfolio construction trade-off rather than a strict improvement:
The intermediate buckets remain unstable under both specifications. The information is concentrated in the tails of the distribution, which is consistent with the nature of social sentiment: users are considerably more likely to post when their view is strongly held.
This note demonstrates that sentiment data from Context Analytics sourced from Twitter messages can be effectively leveraged for global trading strategies. The JPX data contains a tradable cross-sectional signal, mainly concentrated in the top quintile and notably smooth when expressed as a long/short spread. In a market where many listed companies carry little coverage, a dataset that tracks close to 2,000 of them every trading day represents a substantial addition to available information.
Context Analytics’ S-Factor feed is a long-standing product that is applied to a variety of asset classes. For more information on our global coverage, please visit www.contextanalytics-ai.com.
Data and disclosures
All performance figures are gross of transaction costs, financing and borrow, and represent backtested results displaying the predictive nature of the sentiment factor. Past performance is not indicative of future results. Nothing in this document constitutes investment advice or an offer to buy or sell any security.