 company
Background
One of CA’s previous blogs looked at SEC filings in a straightforward way: count the number of words in the whole document, measure the change in word count versus the prior filing, and sort stocks on the result. Companies whose filings barely changed outperformed. Companies that made substantial edits changing the length of the document lagged. The underlying idea traces back to Cohen, Malloy and Nguyen’s “Lazy Prices”, which found that firms revising their filings heavily go on to underperform those that leave them alone.
Since 10-Ks and 10-Qs have so much textual information, we wanted to test whether looking at changes in individual items within the reports would yield similar or differing results. Each Item or section carries different types of information. The Management Discussion & Analysis section is where the company narrates its own performance. And Risk Factors is where the company discloses what could go wrong.
This blog post tests that. We take the same 2006–2026 history and rerun the analysis on the MD&A and Risk Factors sections separately, looking at two factors for each:
- Magnitude % Change in Word Count — the absolute percentage change in section length versus the prior filing of the same type. Direction-agnostic; a section that grew 20% and one that shrank 20% both score 0.20.
- Raw Change in Sub-section Count — the signed change in the number of sub-sections within the section. Unlike the magnitude factor, this one keeps its sign: negative means sub-sections were removed, positive means they were added.
That second factor asks a different question than anything in the previous blog post. Word count measures how much the text has changed. Sub-section count measures whether the section’s structure changed; whether management added new headings to cover new ground, or consolidated existing ones. Because the factor is signed, the quintiles order by direction rather than by size, and the results turn out to depend on which way the structure moved.
Methodology
Construction follows the previous post, with the section-level data replacing the total-document data. The MRF dataset parses SEC EDGAR filings into machine-readable JSON with word counts, sub-section counts, and sentiment metrics at the document, part, and item level; here we take the MD&A and Risk Factors sections and compare each filing to the same company’s most recent prior filing of the same type, so 10-Ks are compared to 10-Ks and 10-Qs to 10-Qs.
- Each filing section is scored on the factor.
- Stocks are sorted into quintiles cross-sectionally each month and equally weighted within each portfolio.
- Stocks enter on the last market day of the month the report is released and are carried for up to four month-ends, or until a new report of the same type arrives. Rebalance monthly.
The universe is the broad one from the previous post: stocks trading above $5 with market capitalization above $10M, from December 2006 through April 2026. One filter differs between the two sections. Because MD&A and Risk Factors sections are far shorter than a full filing, the minimum word count that screens out documents is set to 10 words for MD&A and 5 words for Risk Factors, against 250 for the total document. That leaves roughly 3,225 stocks a month for the MD&A tests (~645 per quintile) and roughly 2,695 for Risk Factors (~539 per quintile). Risk Factors have lower counts of securities per bucket because many 10-Qs do not provide information in the Risk Factors section.
Results: Management Discussion & Analysis
Magnitude % Change in Word Count
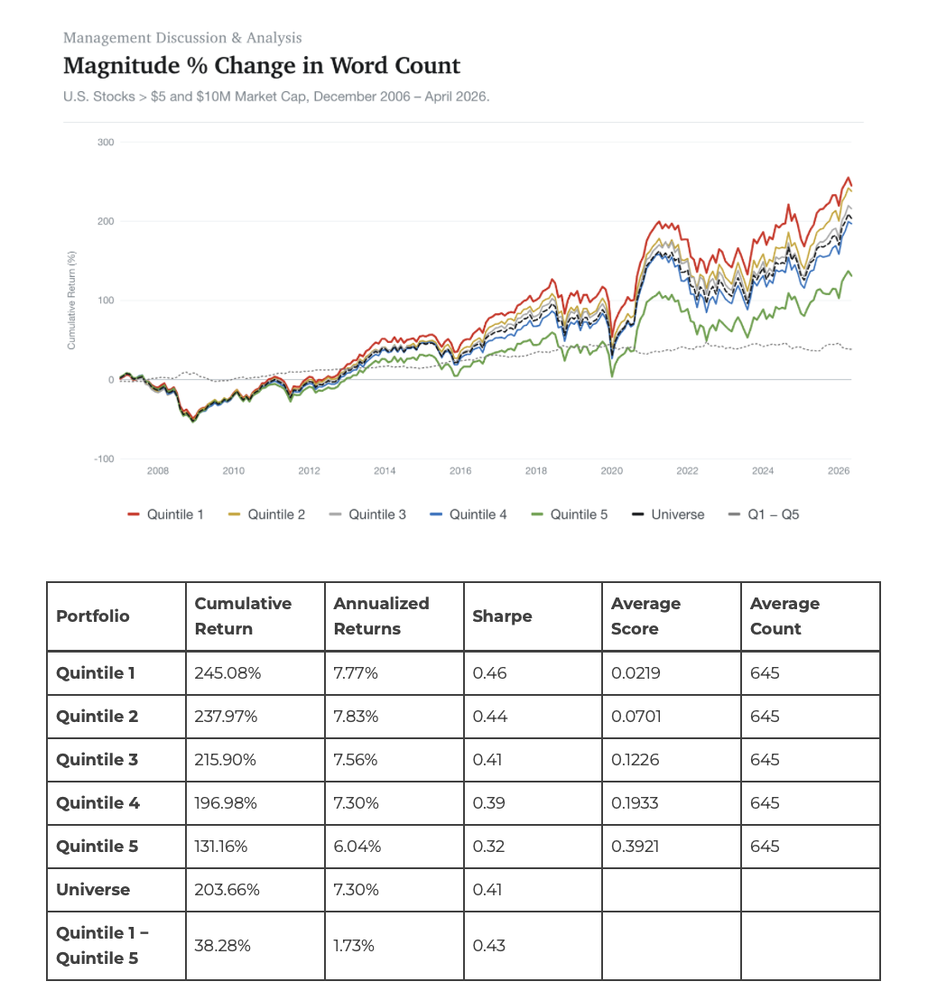
The ordering is close to monotonic and points the same direction as the total-document result. Quintile 1, where MD&A length moved about 2% between filings, had an annualized return of 7.8%, against 6.0% for Quintile 5, where the average section changed by 39%. The Sharpe ratio declines cleanly from 0.46 to 0.32 across the quintiles.
This displays companies that have significant changes in the Management Discussion & Analysis portion often underperform their peers. While companies who stay consistent (fewer changes) year-over-year or quarter-over-quarter have exceeded the market average.
Raw Change in Sub-section Count
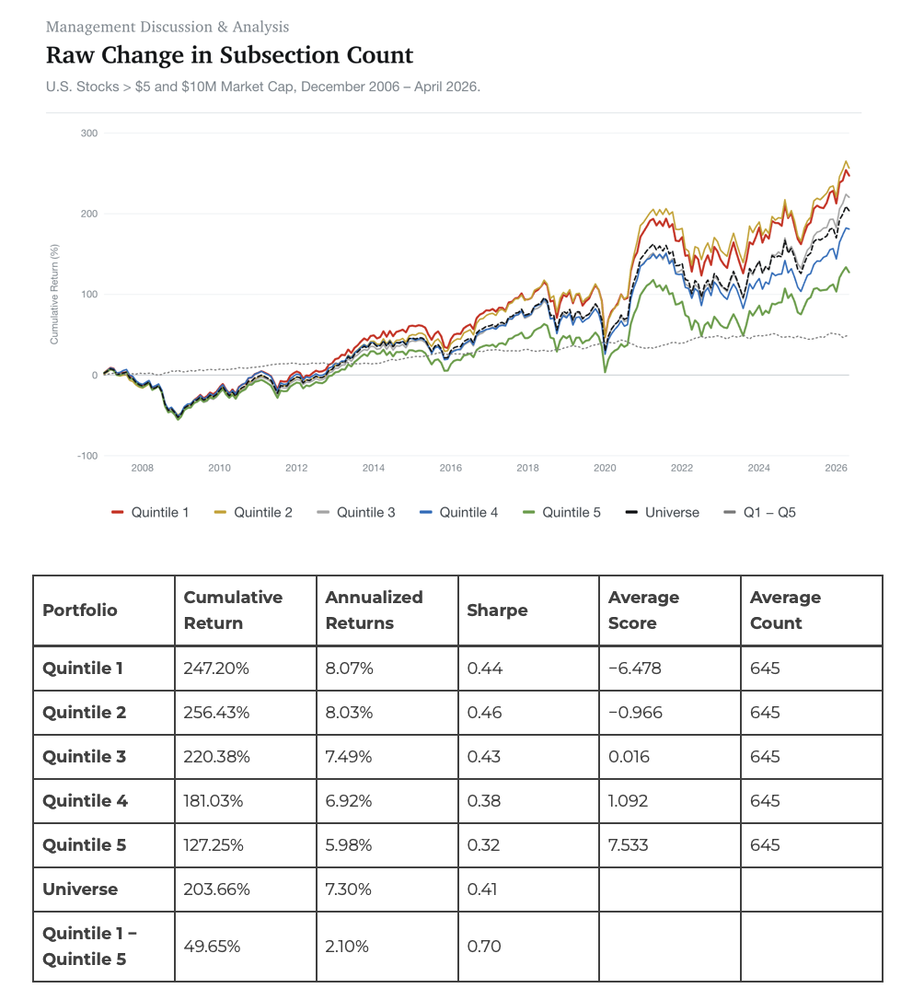
Change in Sub-section Count yields a strong spread between Quintile 1 and 5. Note what the average scores say about the quintiles: Q1 companies stripped out roughly six and a half sub-sections from their MD&A, while Q5 companies added seven and a half.
Removing sub-sections from the MD&A section is fine. Adding them is not. Q1 returned 8.1% annualized while Q5 returned 6.0%. The Q1 − Q5 spread is 2.1% annualized with a Sharpe of 0.70, higher than any of the quintiles individually. Companies that expand the structure of their MD&A, adding new headings or new topics requiring their own discussion, subsequently underperform. Companies that consolidate or remove headings tend to outperform the universe.
Results: Risk Factors
Magnitude % Change in Word Count
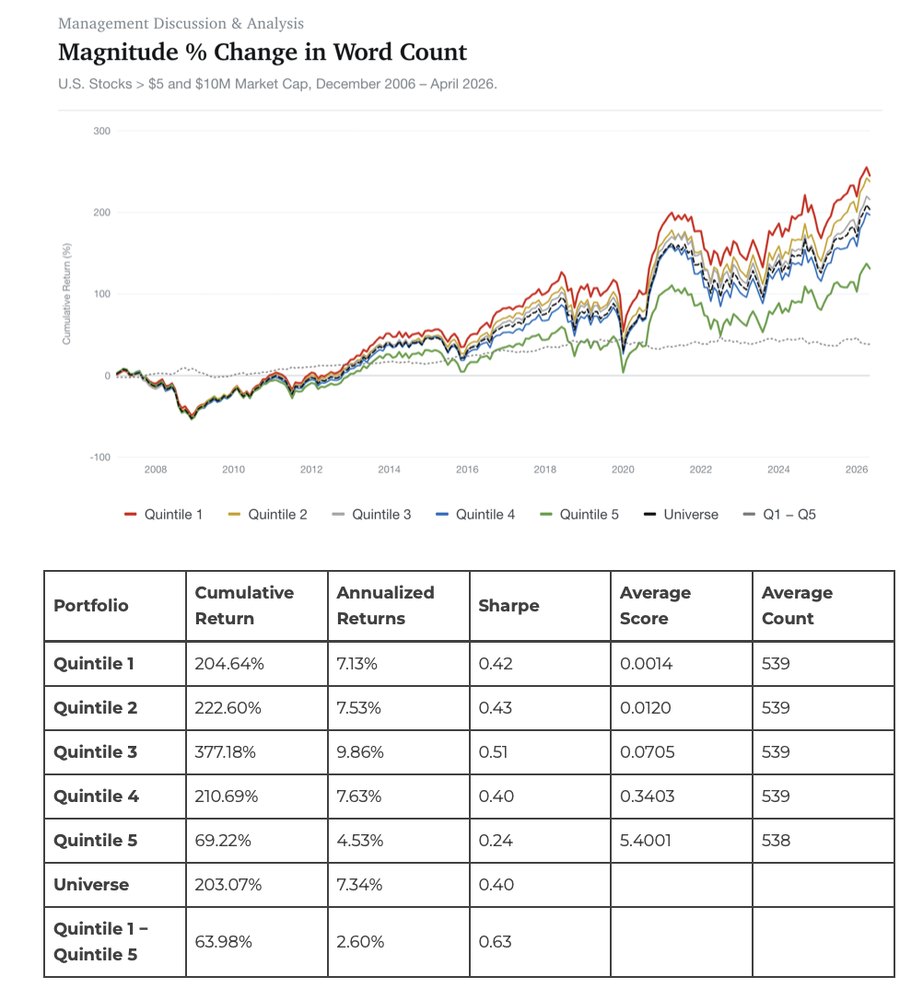
Risk Factors produces one of the better short-side signals in the study. Companies that rewrite their risk disclosure at scale go on to underperform the market by a wide margin. Quintile 5 returned 4.5% annualized against a 7.3% universe, a significant underperformance.
Quintiles 1 through 4 have tightly grouped average scores, with section length changing by between 0.1% and 34%, and their returns do not order cleanly within that range. The separation happens at Quintile 5, where the average section changed by 540%.
That 540% figure, against 39% for the equivalent MD&A bucket, shows how differently the two sections behave. Risk disclosures get rewritten when circumstances change, and a rewrite on that scale signals newly disclosed risks. One caveat on the magnitude: the 5-word section floor admits very short sections, where small denominators produce large percentage changes, so part of the Q5 tail reflects arithmetic rather than genuine rewriting. At the other end, the Q1 average score of 0.001 confirms the low bucket is made up of sections that were essentially untouched.
Raw Change in Sub-section Count
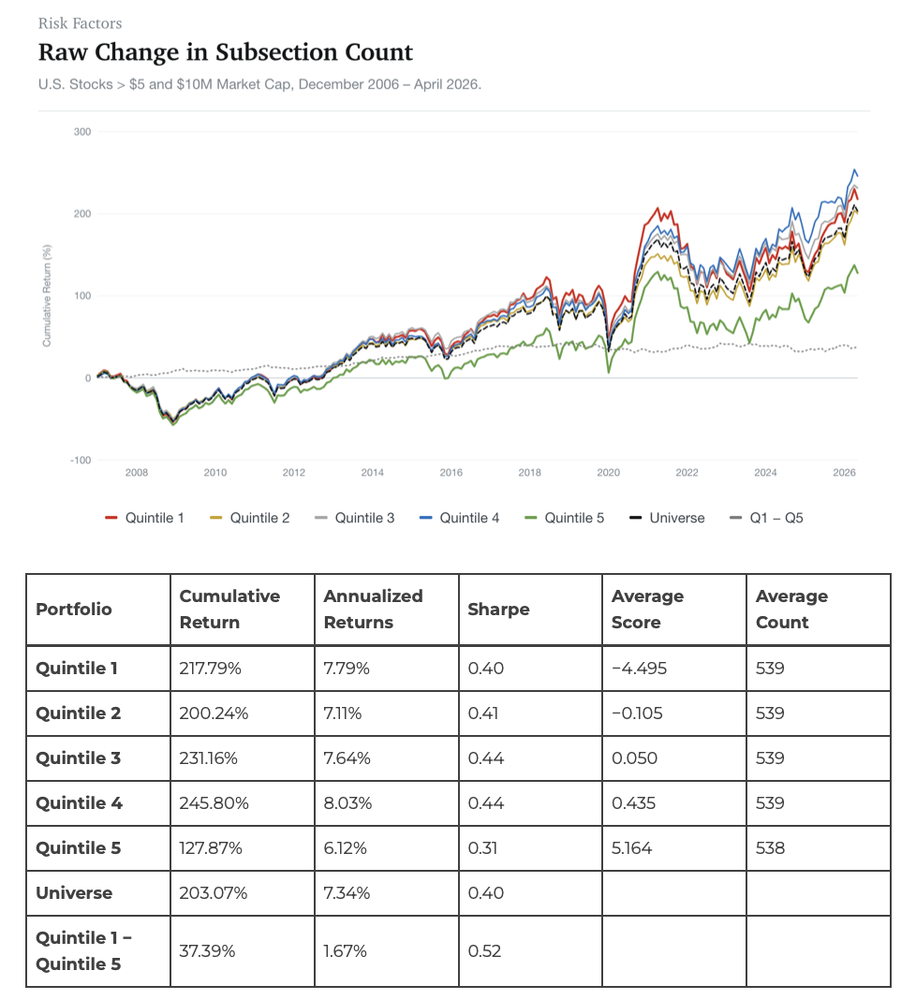
A similar directional pattern to MD&A appears here. Quintile 5, made up of companies adding about five risk sub-sections, returned 6.1% annualized against a 7.3% universe, an underperformance.
The first four quintiles return between 7.1% and 8.0% and are difficult to separate from each other or from the market. Adding a meaningful number of new risk sub-sections is the bearish signal; the rest of the distribution carries little information.
Conclusion
All four spreads run in the same direction. Whether sorted on how much a section changed or on how many sub-sections it gained, the low quintile beat the high quintile in both MD&A and Risk Factors, across nearly twenty years and both filing types.
Structure carries information that length does not. Raw Change in Sub-section Count in the MD&A section has the highest long-short Sharpe of the four factors in this blog at 0.70. Counting how many sub-sections management added is different than counting how many words they wrote. New headings mean new topics that needed separating out, such as a segment reclassified or a contingency broken into its own discussion, and that appears to be a cleaner marker of change than length, which absorbs a lot of routine variation.
The two sections also behave differently, and the difference is informative. MD&A sorts cleanly: returns decline almost monotonically across quintiles on both factors, which makes it usable as a ranking signal. Risk Factors concentrates its information in the top bucket, where the extreme rewriters underperform sharply while the rest of the distribution tracks the market. That fits how the two sections are written. MD&A is revised incrementally each period as performance evolves, so the size of the revision scales with how much changed. Risk disclosures tend to sit untouched until something forces a rewrite, which produces the sparse distribution and the concentrated signal.
Substantial revisions to a filing are rarely discretionary. When management adds new sub-sections, to MD&A or to Risk Factors, it is usually because something now requires a disclosure that did not before, and that skews negative. What the section-level results add is that the structural footprint of that decision is at least as informative as its word count.
Data: CA Machine Readable Filings, built on S&P Global Market Intelligence textual data from SEC EDGAR. Broad universe, close ≥ $5, market cap ≥ $10M, December 2006 – April 2026. MD&A tests apply a 10-word section minimum; Risk Factors tests apply a 5-word minimum. Average Score values are rounded from the chart output.
Reference: Cohen, L., Malloy, C., & Nguyen, Q. (2019). “Lazy Prices.” SSRN.