 company
Twitter sentiment and SPY around the 2014, 2018, 2022 and 2026 midterm elections
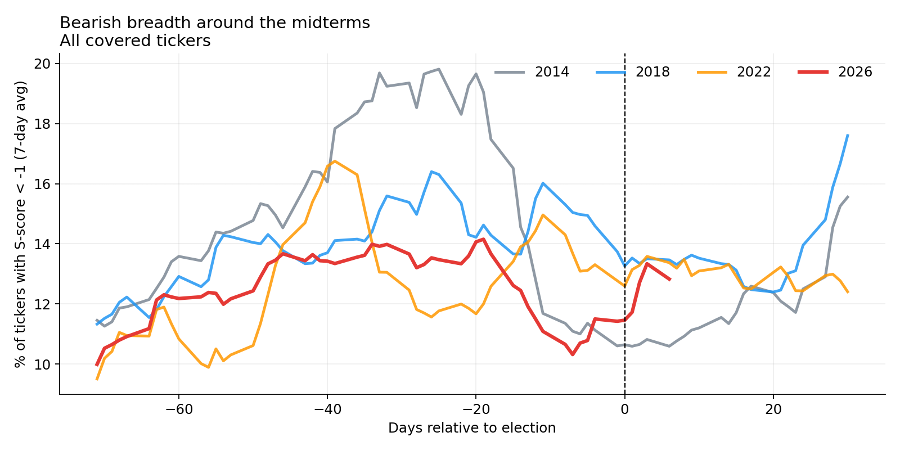
Going into the 2026 midterms, the market looked relaxed. Bearish sentiment on US stocks was the lowest of four midterm cycles, SPY volatility sat near 10%, and attention to stocks stayed high. Two days after the vote, volatility, price and bearish sentiment all turned. In the first week after the election, 2026 posted the biggest volatility jump, the deepest SPY drawdown and the sharpest rise in bearish sentiment of the four cycles.
How we measure sentiment
Context Analytics tracks Twitter conversation on every US-listed equity and scores it continuously with our proprietary NLP model. The result is the S-Factor sentiment data used throughout this piece. Four terms recur:
- S-score: a ticker's daily sentiment score (standardized to a 20-day baseline). A score below -1 counts as bearish, and below -2 as extremely bearish.
- Bearish breadth: the share of tracked tickers with an S-score below -1 on a given day. It shows how widespread negative sentiment is, not how negative any one stock is.
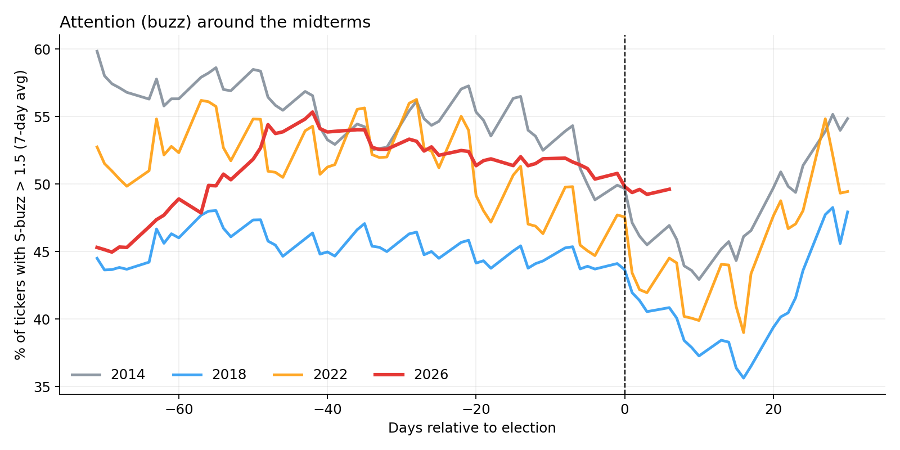
- Attention breadth: the share of tickers with an S-buzz above 1.5, meaning conversation volume well above that ticker's norm.
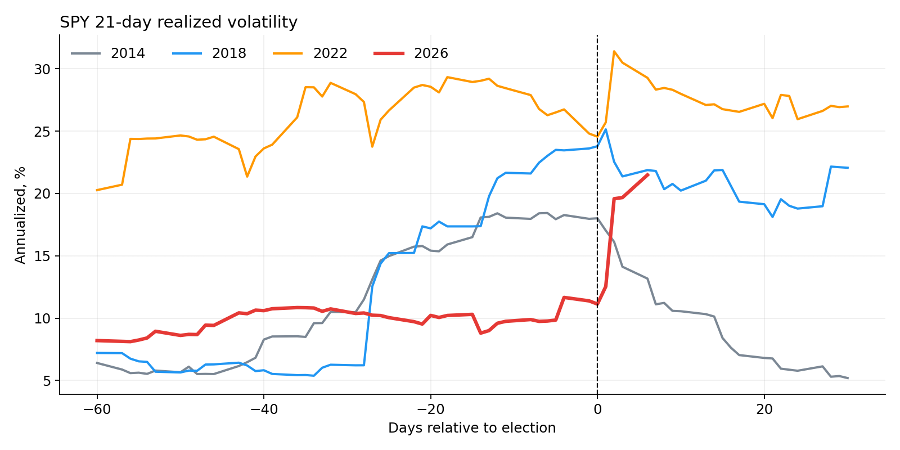
- Realized volatility: the annualized standard deviation of SPY's daily returns over the past 21 trading days.
Day 0 is election day in each cycle (Nov 4 2014, Nov 6 2018, Nov 8 2022, Nov 3 2026). The 2026 data runs through November 9, day +6.
Act one: low fear, high attention
Bearish breadth rose into the vote in every cycle, but 2026 started from the lowest base and never climbed far. Its 7-day peak was 14.2%, against 19.8% in 2014, 16.4% in 2018 and 16.7% in 2022.
Attention was high. In the 30 days before the vote, 51.6% of tickers drew unusual attention (S-buzz above 1.5). Only 2014 was higher, at 53.6%, and that year's universe was the thinnest of the four. 2018 averaged 44.7% and 2022 averaged 49.5%.
SPY was just as quiet. Its 21-day realized volatility averaged 10.0% over the 30 days before the vote, against 16.2% in 2014, 17.8% in 2018 and 27.5% in 2022. The 2022 level was nearly three times as high.
Act two: November 5
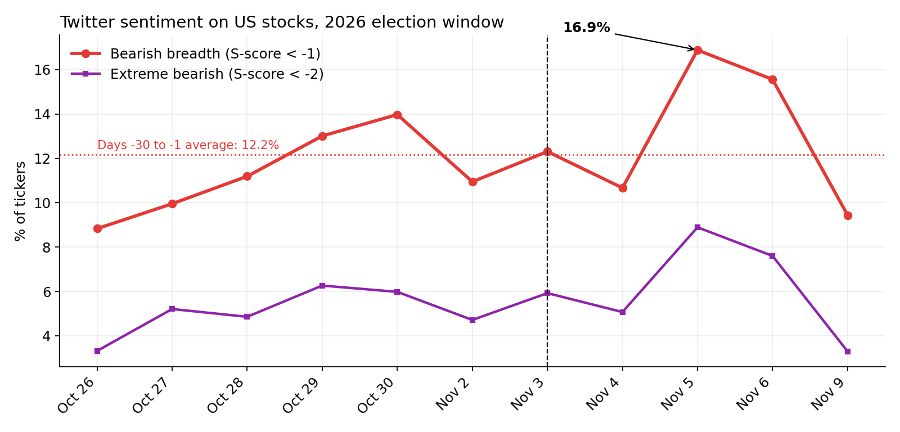
SPY gained 1.7% on November 4, the day after the vote, and bearish breadth fell to 10.7%. Then SPY closed 4.4% lower on November 5.
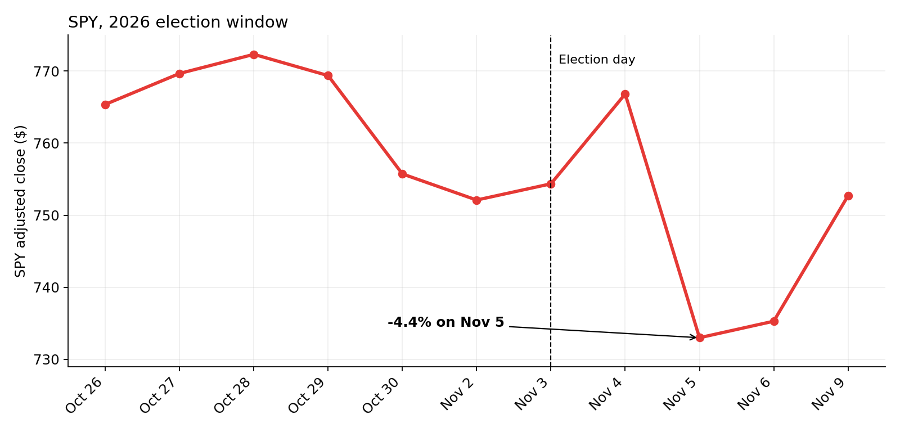
Twitter sentiment broke on the same day. Bearish breadth rose from 10.7% to 16.9%, a 6.2-point one-day jump and the largest in the 68 days of the 2026 window. The share of tickers scoring below -2 went from 5.1% to 8.9%.
Attention did not fade after the vote either. In 2014, 2018 and 2022, the share of tickers with unusual buzz fell 4 to 4.5 points from the last week before the vote to the first week after (48.4% to 43.9%, 43.0% to 38.8%, 45.5% to 41.2%). In 2026 it went from 49.7% to 49.6%.
Act three: the scoreboard
Set side by side, 2026 has the lowest bearish breadth and lowest volatility in the run-up, the second-highest attention, and the largest value in every reaction row.
| 2014 | 2018 | 2022 | 2026 | |
| Run-up (days -30 to -1) | ||||
| Bearish breadth, average | 14.2% | 14.5% | 13.0% | 12.2% |
| SPY realized volatility, average | 16.2% | 17.8% | 27.5% | 10.0% |
| Attention breadth, average | 53.6% | 44.7% | 49.5% | 51.6% |
| First week after the vote | ||||
| SPY volatility change, day -1 to day +6 | -4.8 pts | -1.7 pts | +4.5 pts | +10.1 pts |
| SPY drawdown from running high | 0.0% | -3.2% | -2.1% | -4.4% |
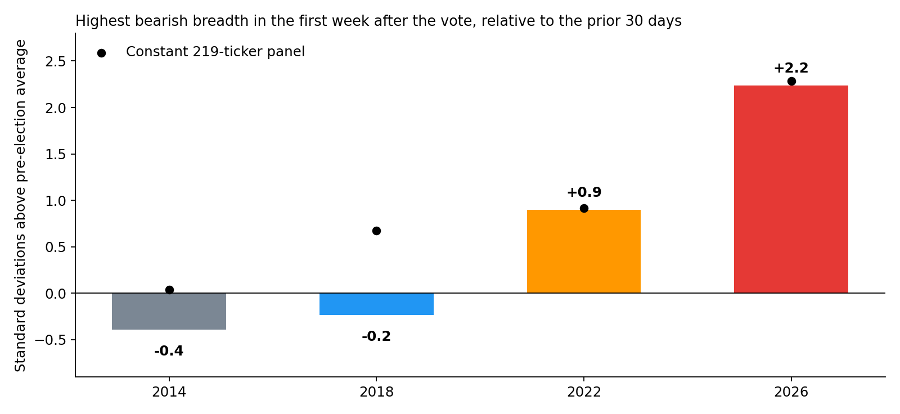
| Peak bearish breadth vs prior 30-day average | -0.4 sd | -0.2 sd | +0.9 sd | +2.2 sd |
| Peak extreme-bearish share | 6.1% | 6.6% | 7.3% | 8.9% |
The sentiment spike stands out most. Measured against each cycle's own pre-election variation, the first-week peak in bearish breadth was +2.2 standard deviations above average in 2026. That compares with +0.9 in 2022, -0.2 in 2018 and -0.4 in 2014.
Why this matters for the next big event
In 2026 the usual indicators gave little warning. Volatility was at 10% and fear was at a four-cycle low, yet the first week after the vote produced the sharpest reaction in all four cycles. Sentiment data picked up the shift on the same day the price did, and it showed how widespread the change was across US equities, not only in the index.
Elections are one of many scheduled events that can move markets. Fed decisions, major policy announcements and earnings seasons are others. Tracking macro sentiment around them shows where anxiety is building before the event and how fast it clears afterward.
We will keep monitoring the 2026 data and publish an update when the +30 day window closes on December 3. To track S-Factor sentiment around the next major event, or to see this analysis at the sector level, contact the Context Analytics research team at www.contextanalytics-ai.com.