The past year equity markets have seen significant volatility. From early-2025 drawdowns to sharp mid-year rebounds and new all-time highs later in 2025, investors have had to navigate an environment dominated by macro headlines, geopolitical risk, and rapid developments in emerging fields. Markets have shifted from fear to optimism and back again in 2025, opening opportunities for investors.
At Context Analytics, our Twitter-based S-Score continued to demonstrate stable performance throughout 2025—right through drawdowns, recoveries, and regime shifts.
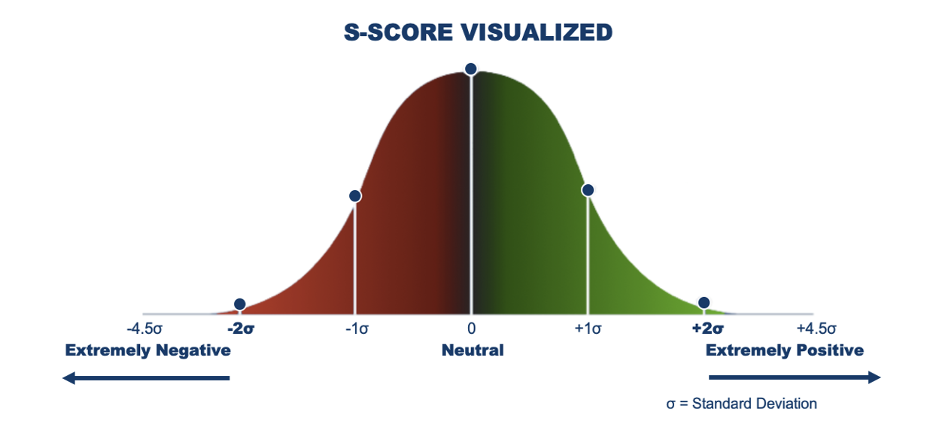
What the S-Score Measures
The S-Score is a standardized sentiment signal derived from Twitter conversation. It measures how unusually positive or negative current social media sentiment is for a security relative to its own historical norm. It is derived from an exponentially weighted sum of sentiment from messages over the past 24 hours, where more recent messages carry greater influence. This current sentiment level is then standardized using the security’s 20-day historical mean and standard deviation, producing a z-score that indicates how extreme today’s conversation is compared to typical activity. A high S-Score reflects sentiment that is significantly more positive than normal, while a low S-Score indicates sentiment is significantly more negative. Extreme S-Scores signal periods when social sentiment deviates meaningfully from average levels and may be associated with subsequent outperformance or underperformance of the security.
2025 Open-to-Close Quintiles
To evaluate the relationship between Twitter S-Score and subsequent intraday performance in 2025, we conducted a daily quintiles test. Each trading day, securities are ranked by their Twitter S-Score at 9:10am ET and grouped into five equal-sized portfolios. Quintile 5 contains the top 20% of securities with the highest S-Scores, while Quintile 1 contains the bottom 20% with the lowest S-Scores.
We then calculated daily Open-to-Close returns for each security. Securities within each quintile are equally weighted to form daily quintile portfolios, and returns are compounded over time. The chart shows the cumulative Open-to-Close performance of these quintiles from January 2025 through the end of the year for stocks priced above $5.
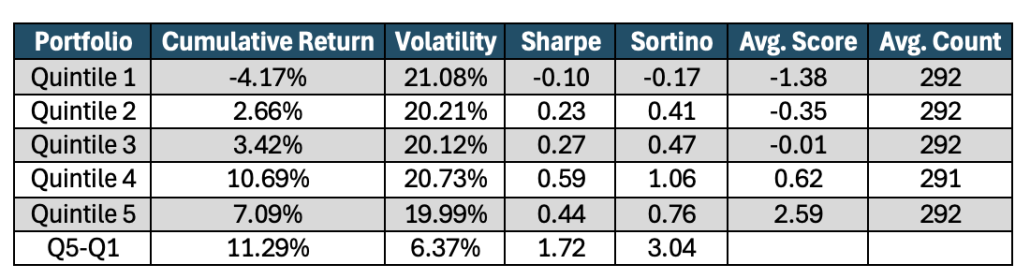
The results show a clear and persistent relationship between Twitter S-Score and intraday returns. Securities in higher S-Score quintiles consistently outperform those in lower quintiles. In 2025 the quintiles are not displaying perfect monotonic relationship, with Quintile 4 having the strongest performance. However, Quintile 1 exhibits the weakest performance compared to the rest of the universe, reflecting the underperformance of securities with extremely negative Twitter sentiment.
The spread portfolio (Quintile 5 – Quintile 1) delivers a positive and steadily rising cumulative return, indicating that Twitter S-Score contains meaningful predictive information for same-day Open-to-Close price movements. This large and persistent performance differential highlights the effectiveness of Twitter-based sentiment as a signal and suggests its potential utility in long/short intraday trading strategies.
Extreme Sentiment Driving the Strong Intraday Returns
Piggybacking off the quintile analysis, we take the next step by focusing on the extremes of the S-Score distribution—where the relationship between sentiment and subsequent intraday returns is most pronounced. Rather than ranking the entire universe, we isolate only the most extreme sentiment observations by forming two portfolios: a Long Only portfolio consisting of securities with an S-Score greater than +2, and a Short Only portfolio consisting of securities with an S-Score less than −2.
Using a Price > $5 Universe, we calculate daily Open-to-Close returns for each security meeting these thresholds. Securities within each bucket are equally weighted to create daily portfolio returns, which are then compounded over time. The chart below shows the cumulative performance of the Long, Short, and Long/Short portfolios alongside SPY as a benchmark.
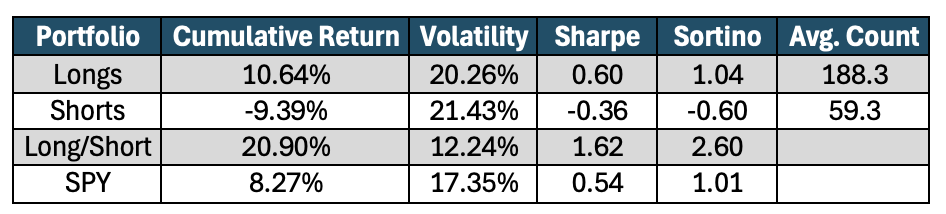
The results clearly highlight the strength of extreme sentiment signals. Stocks with highly positive sentiment (S-Score > 2) generate consistent positive cumulative returns throughout 2025, while stocks with highly negative sentiment (S-Score < −2) underperform significantly. Importantly, the Long/Short portfolio exhibits a persistent and widening spread, demonstrating that extreme sentiment captures a robust intraday alpha signal.
Compared to the broader quintile results, this threshold-based approach amplifies the signal by concentrating exposure in the most information-rich observations. In other words, when sentiment reaches extreme levels on Twitter, it is far more likely to translate into meaningful same-day price movement—making this framework particularly attractive for short-horizon trading and long/short strategy construction.
The 2025 results reinforce the value of Twitter-based sentiment as a timely and actionable market signal. Across a year defined by geopolitical headlines and elevated volatility, the S-Score consistently differentiated winners from losers on an intraday basis. Both the quintile and threshold analyses demonstrate that securities with relatively stronger sentiment tend to outperform, while those with extremely negative sentiment lag—highlighting the robustness of the signal across market environments.
At Context Analytics, we continue to demonstrate that when social sentiment is properly cleaned, standardized, and structured, it can remain a durable and actionable signal across market regimes.
For more information, visit www.contextanalytics-ai.com.
TL;DR