Context Analytics is the leader in processing and structuring textual data for sentiment analysis. One of our longest-running and most widely deployed products is the S-Factor® feed. This feed contains a suite of metrics that measures investor sentiment, using social-media-derived text, separated by source.
Among these sources, Twitter (X) remains critical due to its real-time information velocity and rich financial discussion. Our systems read every message containing identifiers from a security’s topic model—including ticker symbols, company names, and related entity references.
Each message is scored for sentiment on a range from –1.000 to +1.000, then aggregated over a 24-hour window. These aggregates are compared against a rolling 20-day historical baseline, producing our S-Factors, which update every minute.
What Is the S-Score?
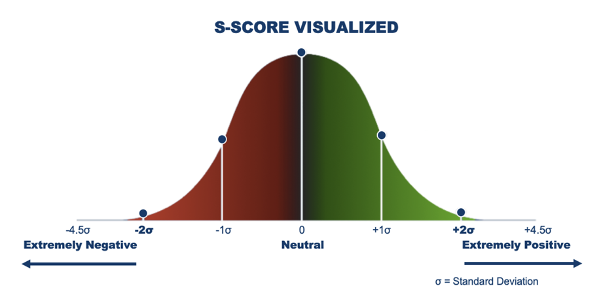
At the center of the S-Factor suite is the S-Score - a normalized indicator showing how today’s sentiment compares to the asset’s own history.
It is defined as:
S-Score = Exponential 24-hour sentiment sum compared to its 20-day mean (SMean) and volatility (SVolatility)
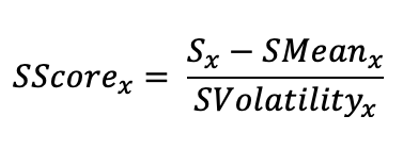
This exponentially weighted formulation means that messages from the past few minutes carry more influence than those from hours ago. That structure allows the S-Score to:
For Open-to-Close predictions, we use 9:10am ET S-Scores; for Close-to-Close performance, we use 3:40pm ET values.
The S-Score has shown predictive power for nearly a decade—particularly in equally weighted quintile portfolios, where high-sentiment securities (Quintile 5) consistently outperform, and low-sentiment names (Quintile 1) underperform.
But in practice, portfolio managers rarely assign equal weights. They size positions based on conviction, magnitude, or signal strength.
This raises a key question:
Can the magnitude of the S-Score itself improve portfolio construction?
From Stock Selection to Portfolio Weighting
To answer this, we ran a simple test.
Step 1 — Traditional Quintiles (Baseline)
We form standard equal-weighted S-Score quintiles using our 3:40pm ET daily signal, evaluating daily Close-to-Close returns.
Step 2 — S-Score Weighted Portfolios (New Approach)
Within each quintile, instead of equal weight, we weight stocks by the absolute magnitude of the S-Score:
We then compute:
The test window starts January 2016 and runs through the present.
The Results: Magnitude Matters
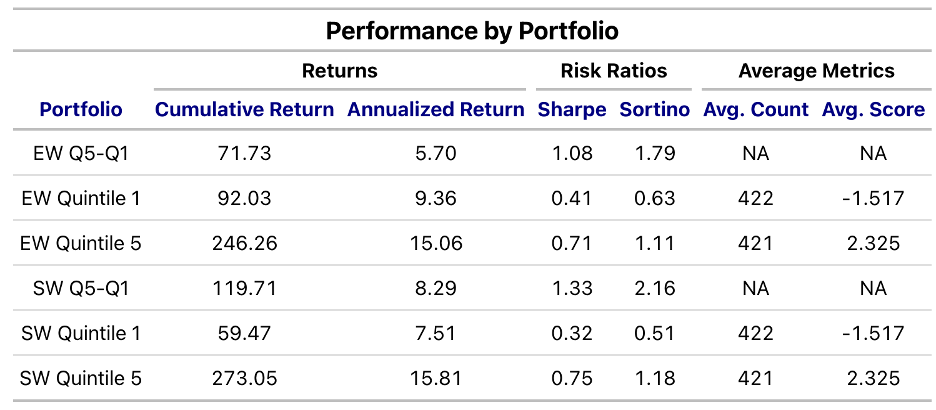
Weighting by S-Score meaningfully enhances both long-only and short-only performance.
1. Shorting Becomes More Powerful
Quintile 1 (Q1)—our short book—improves materially:
This means the most negative sentiment names are more reliably bad and emphasizing them captures that effect.
2. Long-Only Performance Strengthens
Quintile 5 (Q5)—our long book—also benefits:
The highest positive S-Scores contain meaningful incremental information about forward returns. Weighting by signal strength captures this.
3. The Long/Short Portfolio Sharpens Significantly
The Q5–Q1 spread sees the biggest improvement:
The enhanced risk-adjusted metrics indicate that magnitude weighting extracts more of the true cross-sectional sentiment signal while reducing noise.
Why This Works
Sentiment is not binary.
S-Scores don’t just say whether sentiment is high or low—they convey how extreme it is.
Magnitude captures:
Equal weighting treats all names in a quintile as equivalent, but high-conviction positive or negative sentiment tends to cluster in the tails.
By up-weighting these signals, we extract an additional layer of alpha.
Key Takeaway
The S-Score isn’t just a stock-selection metric. It enhances portfolio construction as well.
Our analysis demonstrates that:
Incorporating S-Score magnitude into weighting improves long-only, short-only, and long/short performance—both in absolute and risk-adjusted terms.
As managers increasingly integrate alternative data into systematic processes, signal-weighted construction represents a robust next step in leveraging real-time social sentiment for alpha generation. For more information, visit www.contextanalytics-ai.com .
TL;DR
Sentiment Strength = Better Portfolio Returns
Context Analytics tested whether weighting stocks by S-Score magnitude (not just rank) improves performance.
Results (2016–present):
Key insight: Extreme sentiment readings contain more predictive power. Weighting by signal strength—not equal weighting—extracts significantly more alpha from real-time Twitter sentiment data.