Introduction: From Unstructured Text to Structured Signal
Context Analytics transforms unstructured financial text into quantitative sentiment signals designed for systematic investment workflows. Our ticker-level social sentiment feed processes large volumes of real-time financial conversation, anchors each observation to a security and timestamp, and produces normalized metrics suitable for cross-sectional comparison.
Outputs include sentiment scores, message volume, dispersion, and volatility measures. These are standardized for comparability across securities and delivered via low-latency RESTful JSON APIs.
This research builds on that foundation. Instead of hand-engineering more standalone features, we explore whether neural network architectures can learn predictive patterns directly from the evolving time series of sentiment signals themselves.
Research Motivation: Sentiment as Trajectory, Not Level
In quantitative finance, sentiment signals are often resorted to rolling z-scores, moving averages, or momentum-adjusted variants. These transformations are effective because sentiment exhibits persistence and cross-sectional return predictability. However, they implicitly treat observations as either independent or linearly weighted across time.
The underlying assumption for this research is stronger: sentiment is not merely a level but a trajectory with shape. A sharp three-day sentiment reversal followed by decay may carry different implications than a steady multi-day sentiment build, even if terminal values match. Rolling aggregates compress these distinctions.
If predictive signals are found in short-term patterns— reversals, accelerations, volatility clusters, participation shifts — then an architecture capable of detecting structured patterns across time and features could outperform fixed linear transformations in some cases.
Convolutional Neural Networks (CNNs), originally designed for spatial pattern recognition in images, provide a natural framework for this problem.
Why a Convolutional Neural Network?
CNNs detect localized patterns using convolutional filters that slide across an input tensor. Through weight sharing, they learn translation-invariant features — patterns are recognized regardless of their position.
For our time series, the analogy is direct:
A convolutional filter applied to a sentiment window learns to detect local structures — reversals, coordinated spikes in volume and dispersion, volatility shifts, etc. — independent of their precise timing within the window.
Crucially, we treat each observation not as a 1D sequence, but as a 2D tensor: time × features. This converts a rolling sentiment window into a small “social sentiment image”, allowing the full CNN toolkit to operate.
Data and Sentiment Image Construction
Data
Features (9 total)
Selected to capture complementary dimensions of the sentiment signal:
Window Construction
For each stock-day, we extract a 30-day rolling window across all nine features, forming a tensor of shape: (30,9)
Each of the 30-day lookback sentiment features is taken at the 15:40 Eastern timestamp, 20 minutes before market close. A channel dimension is added, producing: (1, 30, 9)
This tensor constitutes the sentiment image.
Label Construction
The task is one-day-ahead directional classification of returns:
Train/Test Split
Model Architecture
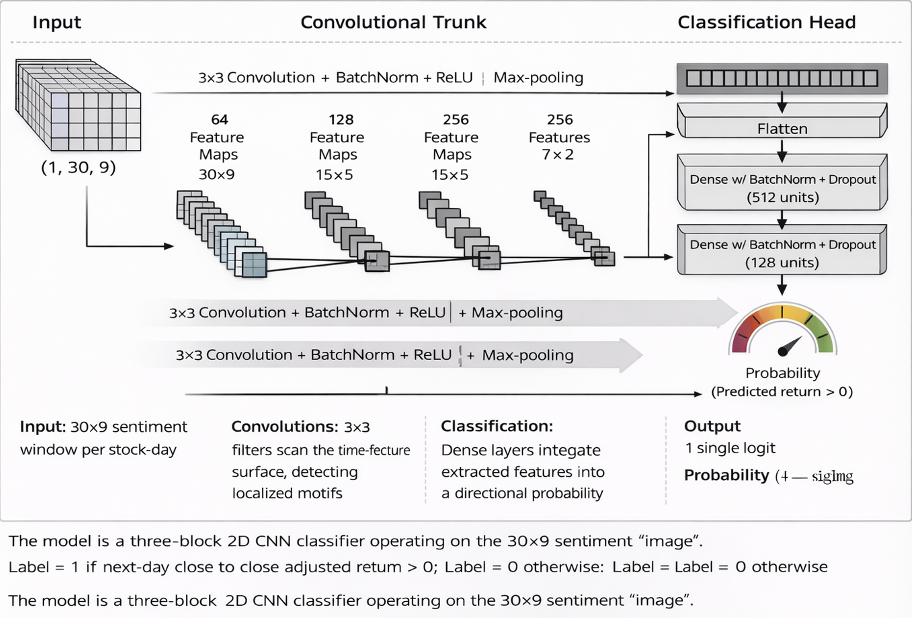
The model is a three-block 2D CNN classifier operating on the 30×9 sentiment “image”.
Convolutional Trunk
Each block consists of a 3×3 2D convolution, batch normalization, ReLU activation, and max pooling. Channel depth increases from 64 → 128 → 256, enabling progressively more abstract feature extraction across the time–feature plane.
Classification Head
The final feature maps are flattened and passed through two dense layers (512 → 128 units) with batch normalization and dropout (25% spatial in convolutional layers, 50% in dense layers). The output is a single logit, converted via sigmoid to the predicted probability of a positive next-day return.
Model Interpretation: Data Flow
The output probability serves as a cross-sectional ranking signal.
Quintile Portfolio Evaluation
Each day in the out-of-sample period (2024–early 2026):
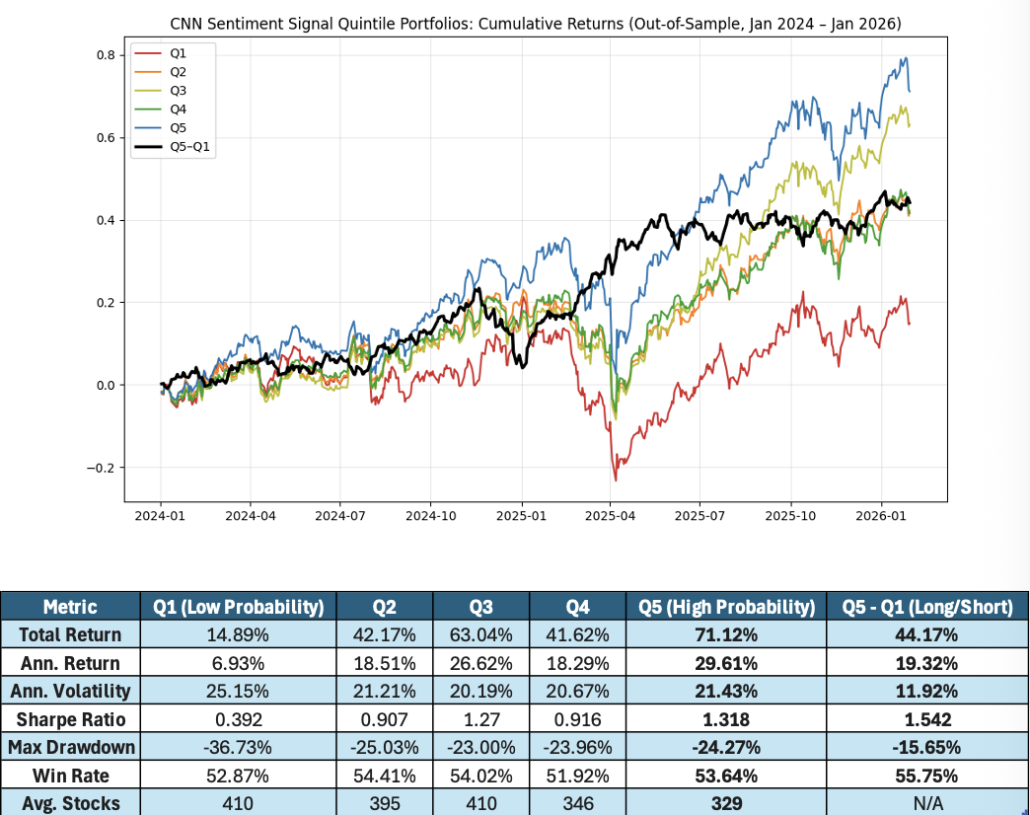
The primary economic metric is the Q5–Q1 spread — a daily rebalanced long-short portfolio that is long the highest-ranked quintile and short the lowest-ranked quintile.
In the out-of-sample period, the top quintile materially outperforms the bottom quintile on both an absolute and risk-adjusted basis. The long-short spread delivers strong returns with substantially lower volatility and drawdowns than either side individually, resulting in the most attractive Sharpe profile across the set. Win rates are modestly above 50% but consistent, indicating incremental edge rather than rare, extreme outcomes.
Taken together, the results suggest that the model is achieving meaningful cross-sectional discrimination. Even without perfect monotonicity across all quintiles, the strength and stability of the Q5–Q1 spread indicate that the CNN is extracting relevant structure from the joint temporal dynamics of sentiment features.
Key Findings and Implications
The central question was whether a CNN trained on rolling 30-day sentiment “images” can extract predictive information beyond traditional sentiment features. The near monotonic quintile spread suggests that it can.
The model is not learning a simple sentiment level or moving average. Instead, it captures multi-day, cross-feature dynamics — interactions between sentiment intensity, participation breadth, and volatility structure — that normal linear aggregations compress.
Two architectural properties are especially important:
More broadly, this work demonstrates a practical framework for applying computer-vision architectures to structured alternative data. By representing multi-feature time windows as 2D tensors, CNNs can model joint temporal and cross-feature structure in a way that traditional rolling transformations cannot.
Whether such approaches generate durable alpha depends on regime stability, transaction costs, and data evolution. What this study establishes is narrower but important: when paired with clean, structured sentiment inputs, convolutional architectures can extract predictive structure that simpler methods can leave unmodeled — expanding the toolkit for systematic alternative data research.
For more information on all our alternative data source, visit www.contextanalytics-ai.com.