Context Analytics' S-Score has an established track record as a predictive sentiment signal in US equities. This study examines whether the same framework translates to the London Stock Exchange (LSE), extending the methodology to British-listed stocks using Twitter-derived sentiment and local pricing data.
Understanding the S-Score
The S-Score quantifies the sentiment of Twitter messages associated with a given security, standardized against that security's own 20-day historical baseline. A positive S-Score indicates above-average positive sentiment; a negative score indicates the reverse.
Because sentiment is measured relative to each security’s own history rather than in absolute terms, the metric is naturally cross-sectional and well-suited to portfolio ranking approaches such as quintile analysis.
For this study, sentiment data is drawn from CA's Twitter S-Factor feed, captured at 16:25 London time (5 minutes before the LSE market close), and matched to the subsequent close-to-close daily price returns.
Research Methodology
Universe Construction
Only securities with active social media engagement (at least 1 post in the previous 24 hours) are included. Securities without any message volume do not generate a sentiment score and therefor are excluded from the universe.
Apply Liquidity Filter
A rolling 10-day average daily volume is computed for each ticker. Only securities where the 10-day average volume exceeds 1 million shares are included in the investable universe on a given day. This removes illiquid names where sentiment signals tend to be noisy and transaction costs prohibitive.
Rank into Quintiles
Each trading day, the eligible universe is ranked by S-Score and divided into five equal buckets. Quintile 1 contains the most negative sentiment; Quintile 5 the most positive. Daily quintile boundaries are recalculated each day using the eligible universe, so the buckets are always cross-sectionally consistent. A stock's quintile reflects its sentiment rank relative to peers on that day.
Compound Daily Returns
Daily returns are calculated from market close prices and equally weighted by portfolio and compounded.
Results
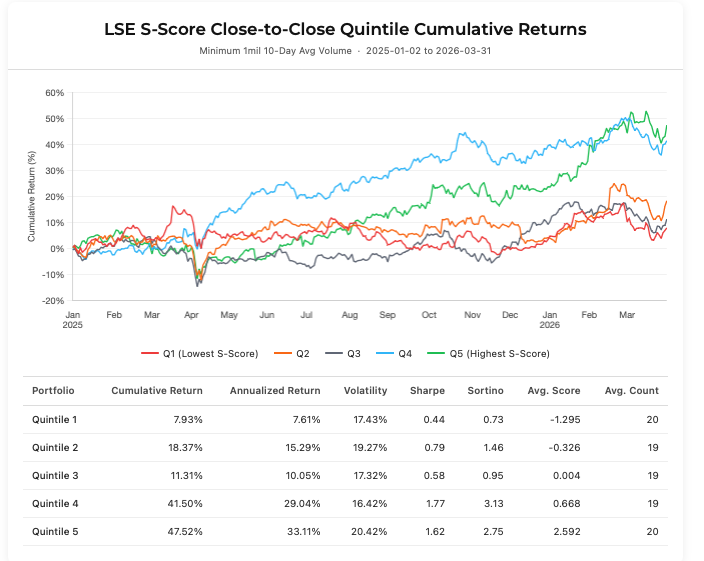
Quintiles 4 and 5 outperformed their lower-ranked quintiles throughout the observation period, exhibiting a broadly monotonic relationship between sentiment rank and subsequent returns. Portfolios constructed from higher S-Score quintiles, representing more positive sentiment, consistently delivered stronger performance, confirming that the signal retains meaningful predictive power.
Incorporating the SV-Score
The predictive relationship strengthens further when an additional dimension of sentiment data is introduced. SV-Score measures abnormal Twitter Message Volume for a given security. Values greater than 0 indicates current message volume exceeds the security’s own 20-day historical average.
Restricting the universe to securities with an SV-Score > 0 (only including securities currently experiencing above-average social media activity) and separating securities into Quintiles, produces a more pronounced return spread.
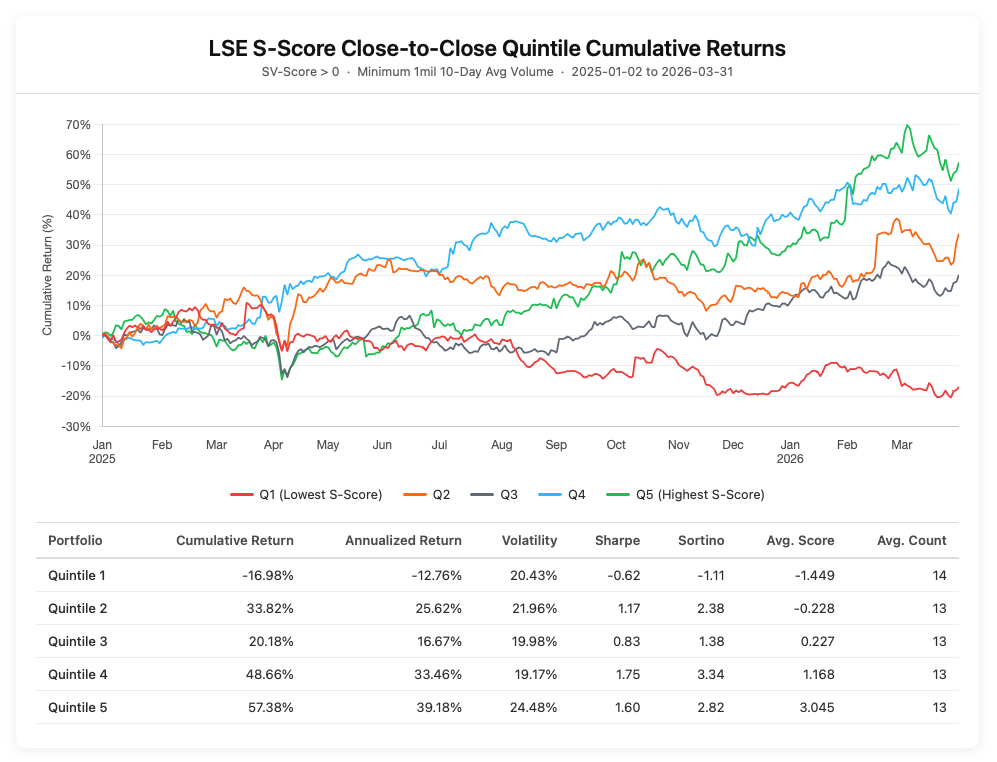
Applying the SV-Score filter reduced the average Quintile size from approximately 19 securities per day to 13, reflecting a more selective approach. Despite the smaller portfolio, the return difference across the extreme sentiment portfolios widened considerable over the sample period. Quintile 5 (most positive sentiment) saw its Cumulative Return increase nearly 10% in the 15-month sample period, while Quintile 1 (most negative sentiment) saw its return drop over 20%. These findings indicate that Message Volume related metrics, like SV-Score, can enhance the power of the S-Score.
Conclusion
This analysis represents a reproducible framework for evaluating whether Twitter sentiment carries actionable forward-return information among LSE-listed equities. By combining a liquidity-filtered universe with daily cross-sectional quintile ranking, it provides both a broad signal sweep and a focused view of return behavior at the sentiment distribution extremes.