 company
Introduction
Since 1993, holding SPY only from market close to the next open, the overnight period, turned $100 into $1,553. Holding it only during the trading session turned $100 into $113 (thetrading.tools).
Other studies confirm this. One study attributes 97.6% of SPY's 1993–2025 gain to the overnight session (EdgeTools), and the academic record runs from Cliff, Cooper and Gulen (2008) to Lou, Polk and Skouras (2019) also support this. In our 2014–2026 sample, SPY's overnight return alone compounded to 198.9%.
The decision that matters is made at the close
If the market earns most of its return while closed, the key decision of the day is what you hold at 4:00 pm. The index drift says hold the market. It does not say which stocks.
Our claim: the stocks with the highest price returns overnight are the ones whose conversation has just turned, loudly. From 2014 to August 2026, the top quintile of a 3:40 pm buzz-weighted sentiment signal returned 14.3% a year overnight, against 9.8% for SPY. The top-minus-bottom spread earned 6.1% a year at a 1.28 Sharpe, before costs.
The conversation does not stop at the bell. Earnings and filings land after the close, and a sharp sentiment shift on heavy volume often leads the next morning's gap.
Building the Signal: ΔS-Score × S-Buzz
The factor multiplies two Context Analytics S-Factors, built from reputable X accounts.
S-Score is a stock's 24-hour sentiment, normalized against its own 20-day baseline. ΔS-Score is today's 3:40 pm S-Score minus the prior day's; we drop it if the prior reading is more than four days old.
S-Buzz measures how loud a stock's conversation is versus the universe, where A is its SV-Score (normalized tweet volume) and B is the universe average SV-Score:
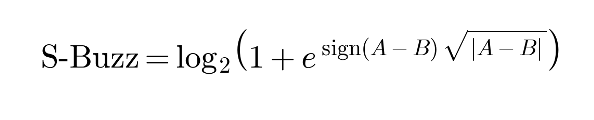
S-Buzz is 1 for an average-volume stock, above 1 when louder, and near 0 when quieter. Because it is always positive, it scales the sentiment change without flipping its sign: the factor is largest when sentiment jumps on heavy chatter and damped when nobody is talking.
Methodology
Each day at 3:40 pm ET, we rank eligible stocks on the factor, sort them into quintiles and measure each quintile's close-to-next-open return.
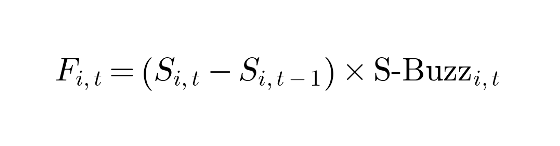
where S is the S-Score of stock i at the 3:40 pm ET snapshot on day t, and F is the factor used to rank stocks into quintiles that day.
| Setting | Choice |
| Sentiment | CA X (Twitter) S-Factors, 3:40 pm ET snapshot, 20 minutes before the close |
| Sample | January 2, 2014 to August 12, 2026 |
| Universe | Point-in-time S&P 500: daily historical constituents, with S-Factor coverage and a close at or above $5. About 390 names a day |
| Portfolios | Five quintiles, equal-weighted, rebuilt daily. Days with fewer than 25 eligible stocks are skipped |
| Return | Adjusted close on day t to adjusted open on day t+1 |
| Data hygiene | Gaps longer than four calendar days dropped; overnight moves beyond ±50% dropped as price errors; returns winsorized daily at the 0.5th and 99.5th percentiles |
| Benchmark | SPY, close to next open, on the same dates |
| Costs | None. Results are gross |
Quintiles average 78 names over the full sample, falling to 62–63 since 2022. The signal is known before the trade: measured at 3:40 pm, entered at the close, exited at the next open.
Results: 2014 to 2026
The factor shows a monotonic relationship with subsequent overnight returns. The top quintile nearly tripled the bottom quintile’s cumulative overnight return and finished about 190 points ahead of SPY. All figures are overnight-only and before transaction costs.
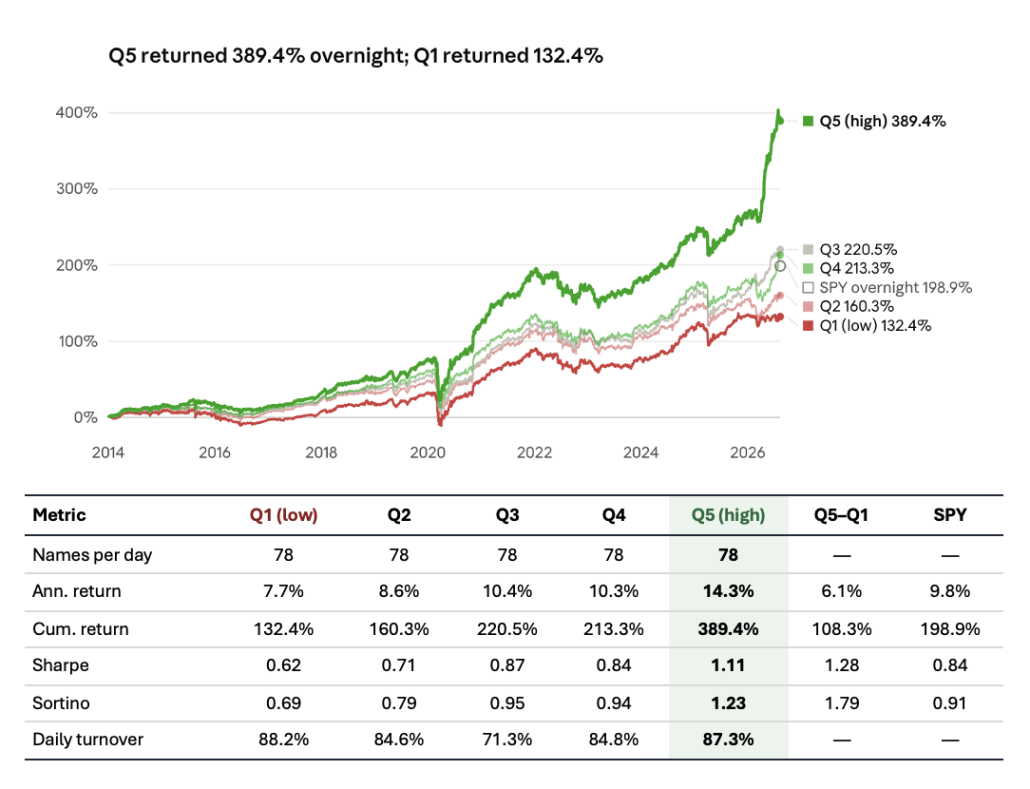
Q5 leads the quintiles on every return and risk-adjusted measure, and the long-short spread has the best risk-adjusted profile in the table. The daily rank IC averaged 0.0074 and was positive on 54.6% of days (t = 5.0): small, as expected over a single night, but persistent.
Robustness: a decade of steady wins, a fade, then a surge
Q5 beat Q1 overnight in 11 of the 13 calendar years in the sample.
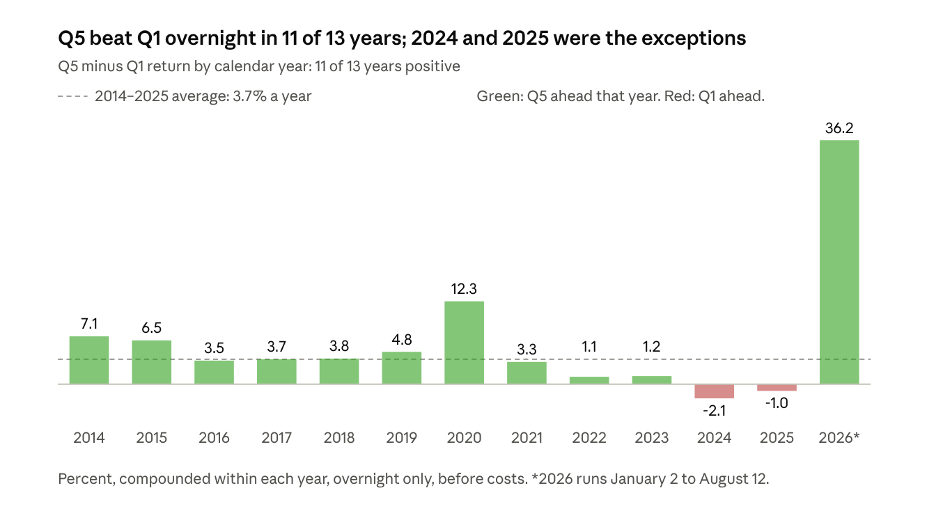
Computed from the daily quintile returns, January 2, 2014 to August 12, 2026 (3,168 days). Each bar compounds the daily Q5 minus Q1 return within the calendar year.
Excluding 2026, the spread still earned 3.7% a year (Sharpe 1.02, IC t = 4.6). But it faded to about 1% in 2022–23 and turned slightly negative in 2024–25, before returning 36.2% in the first seven months of 2026.
Conclusion: put the 3:40 read to work
Most of the market’s return is earned while it is closed, which makes the last 20 minutes of the session the most valuable on the clock. But a pure overnight strategy trades every close and every open, and the top quintile replaces about 87% of its names daily. Each basis point of one-way cost drags roughly 5 points a year per leg. That means Q5’s 4.5-point lead over SPY breaks even below 1 bp per side, and the long-short spread breaks even near 0.6 bp. We have not yet run a cost-adjusted backtest; these break-evens are arithmetic on gross results.
Everything in this study comes from data Context Analytics delivers today. S-Score and S-Buzz are built from reputable X accounts and updated every minute across U.S. Equities, with history back to December 2011. With the S-Factor feed, you can rebuild this test on your own universe with your own costs, then run the 3:40 read live against your book.
The conversation keeps moving after the bell. See what it says about your positions before tomorrow's open. Request a trial today at www.contextanalytics-ai.com.