 company
Adding the overnight change in X (Twitter) S-Score to the pre-open S-Score is a strong predictor for the next session's open-to-close returns. The long–short decile spread is 20.8% a year, and restricting the portfolio selection to stocks with above-average S-Buzz widens the spread to 27.6% a year.
For research purposes only. This is a historical study of how sentiment measures relate to subsequent returns; not a trading model.
Scope: Price > $5 universe, Jan 2014 – Oct 2026, SPY open-to-close as the benchmark.
The Signal
The factor is the 9:10 am S-Score plus its change since yesterday's 3:40 pm reading. Context Analytics publishes S-Factors every minute, but for purposes of this study two sentiment snapshots are used: 9:10 am ET (pre-open) and 3:40 pm ET (pre-close).
\begin{gathered}
F_t = \text{S-Score}_{9:10,\,t} + \left(\text{S-Score}_{9:10,\,t} - \text{S-Score}_{15:40,\,t-1}\right) \\
\text{where } t = \text{today},\quad t-1 = \text{previous trading day}
\end{gathered}
S-Score(9:10, t) is the morning's sentiment score and S-Score(15:40, t−1) the previous trading day's pre-close sentiment score. Both the sentiment level and change get equal weight. F is computed from S-Score values and stocks are then sorted by F each day into quintiles or deciles. When the 15:40 reading for t−1 is missing (no sentiment data), the change is taken as zero.
A stock ranks highest when its sentiment is elevated at 9:10 and rose overnight. A positive score that is fading from yesterday afternoon ranks lower than a score at the same level with no overnight change.
Methodology
| Item | Setting |
| Sentiment | X (Twitter) S-Factors: 9:10 am ET data for day t and the 3:40 pm ET data for day t−1 |
| Universe | US stocks whose prior-day close was at least $5, with S-Volume ≥ 1 at 9:10 am |
| Return | Open-to-close on day t, adjusted prices |
| Portfolios | Daily cut points at every 20th percentile (quintiles) or 10th (deciles); equal weight, rebuilt daily; about 373 names per quintile, 186 per decile |
| Spread | Top bucket minus bottom bucket, daily |
| Benchmark | SPY open-to-close on the same days, compared with the long-only top bucket |
Results
Average open-to-close return rises from the bottom bucket to the top. Over the full sample the decile spread is +20.8% a year at a Sharpe of 3.40. The long-only top decile earns more than SPY open-to-close (+9.0% vs +5.0%) and the bottom decile loses about 12% a year. Over the history the universe averages about 1,864 stocks a day, so each decile holds about 186 securities on an average day.
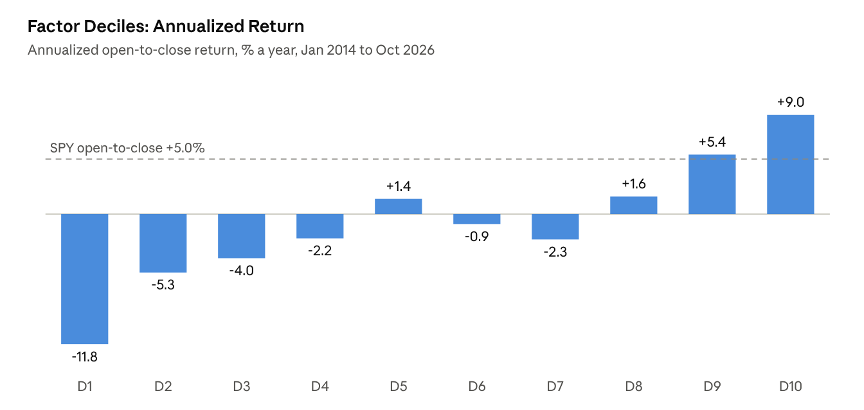
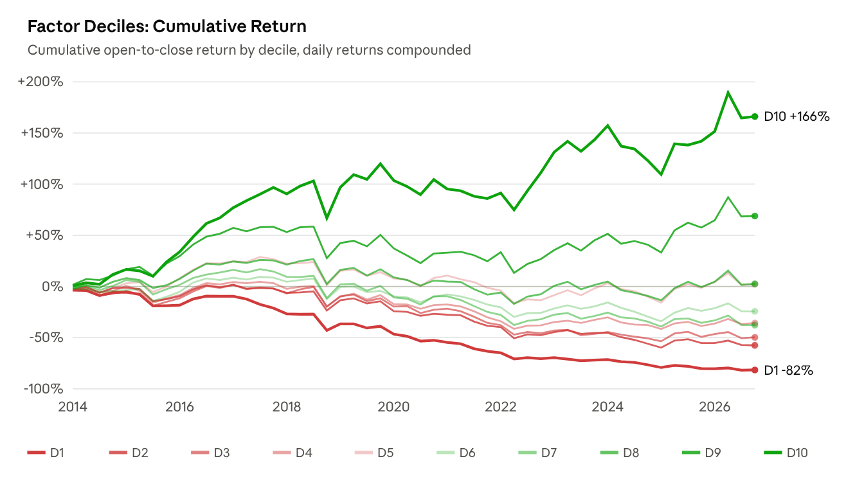
Sentiment is predictive and influential when discussion is at its extremes. Stocks whose pre-open sentiment is strongly positive and rising (D10, and to a lesser degree D9) keep outperforming, and those strongly negative and falling (D1, D2) keep underperforming. The middle deciles hold stocks with close to neutral sentiment; they bunch together near zero and carry little predictive value.
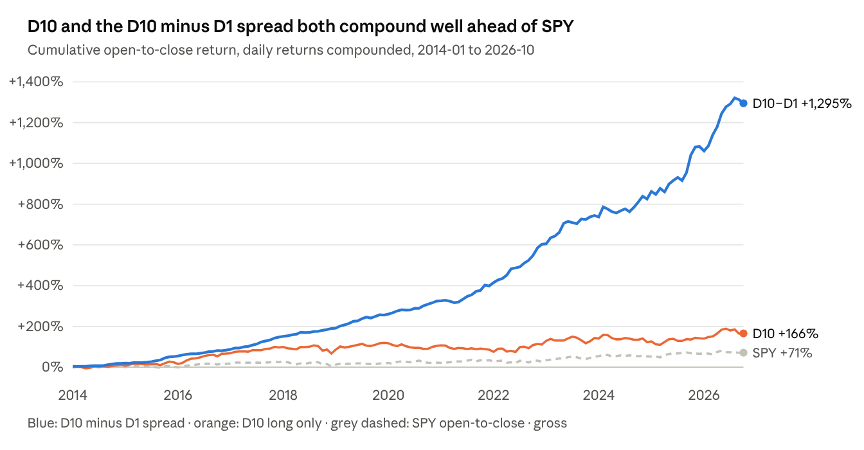
The top decile alone compounds to +166% against +71% for SPY open-to-close. The D10−D1 spread, with far lower volatility, compounds to +1,295%.
Year by year, deciles
The factor's D10−D1 Sharpe is positive in every year. The long-only top decile beat SPY open-to-close in 9 of 13 years.
| Year | Factor Sharpe | Factor spread | Factor top decile | SPY |
| 2026 (to 30 Oct) | 2.33 | +20.3% | +12.4% | +4.1% |
| 2025 | 2.97 | +25.0% | +10.4% | +9.9% |
| 2024 | 1.32 | +9.5% | −7.8% | +1.6% |
| 2023 | 2.98 | +18.7% | +15.4% | +18.3% |
| 2022 | 5.45 | +34.8% | +15.5% | −3.7% |
| 2021 | 2.61 | +16.1% | −8.1% | +9.6% |
| 2020 | 2.83 | +17.8% | −4.4% | +5.2% |
| 2019 | 4.46 | +20.7% | +28.2% | +13.6% |
| 2018 | 3.56 | +15.9% | −15.4% | −17.2% |
| 2017 | 7.37 | +30.2% | +16.8% | +7.4% |
| 2016 | 4.40 | +18.8% | +30.8% | +14.6% |
| 2015 | 4.65 | +25.0% | +11.2% | −2.7% |
| 2014 | 3.32 | +17.4% | +12.1% | +4.7% |
Filtering on S-Buzz
Sorting the same factor only among stocks with S-Buzz ≥ 1 at 9:10 am widens the full-sample decile spread from +20.8% to +27.6% a year, although its Sharpe is slightly lower (3.28 against 3.40). S-Buzz measures how much a stock is discussed relative to the universe (1 is average). As a ranking input, S-Buzz has almost no direction for open-to-close returns. However, as a filter, it concentrates the selection to where there is enough conversation for the sentiment to mean something.
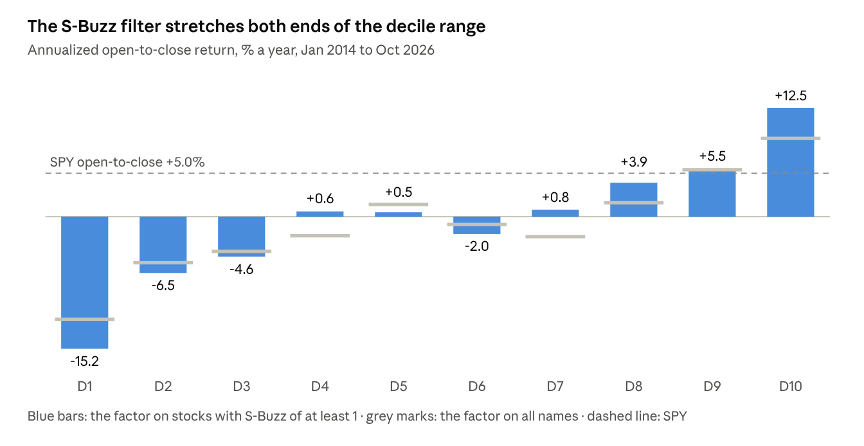
The filter mostly deepens D1 and lifts D10; the middle deciles stay noisy.
Portfolio metrics
| Strategy | Buckets | Ann. return | CAGR | Vol | Sharpe | Sortino | Max DD | Hit rate |
| Overnight Sentiment Momentum | Q5−Q1 | +15.8% | +16.9% | 4.4% | 3.61 | 6.22 | −4.0% | 60.0% |
| Overnight Sentiment Momentum, S-Buzz ≥ 1 | Q5−Q1 | +19.9% | +21.8% | 5.7% | 3.51 | 6.02 | −4.9% | 59.5% |
| Overnight Sentiment Momentum | D10−D1 | +20.8% | +22.9% | 6.1% | 3.40 | 5.81 | −5.2% | 59.5% |
| Overnight Sentiment Momentum, S-Buzz ≥ 1 | D10−D1 | +27.6% | +31.4% | 8.4% | 3.28 | 5.69 | −9.0% | 59.1% |
| Overnight Sentiment Momentum | Top quintile | +7.2% | +6.1% | 16.1% | 0.33 | 0.47 | −27.1% | 52.7% |
| Overnight Sentiment Momentum, S-Buzz ≥ 1 | Top quintile | +9.0% | +8.0% | 16.1% | 0.44 | 0.63 | −27.4% | 53.1% |
| Overnight Sentiment Momentum | Top decile | +9.0% | +7.9% | 16.2% | 0.43 | 0.62 | −26.4% | 52.8% |
| Overnight Sentiment Momentum, S-Buzz ≥ 1 | Top decile | +12.5% | +11.7% | 16.7% | 0.63 | 0.92 | −26.5% | 53.1% |
| SPY open-to-close | — | +5.0% | +4.3% | 12.9% | 0.24 | 0.34 | −24.6% | 53.9% |
Conclusion
- A simple, point-in-time construction. The factor weights the 9:10 am S-Score and its overnight change equally. The 9:10 file is delivered before the 9:30 open, so every input is known before the session it predicts.
- The signal lives at the extremes. The predictive value comes from the outer buckets, where sentiment is strongly positive or negative. The middle buckets hold close to neutral sentiment and do not rank cleanly in any period, which is expected rather than a weakness of the factor.
- A large, persistent spread. The D10−D1 spread earns +20.8% a year at a Sharpe of 3.40 over Jan 2014 – Oct 2026, its Sharpe is positive in every calendar year.
- The long-only top decile beats the market. It earns +9.0% a year against +5.0% for SPY open-to-close and outperformed SPY in 9 of 13 years.
- S-Buzz works best as a filter. Restricting the sort to stocks with S-Buzz ≥ 1 widens the decile spread to +27.6% a year and raises the top decile to +12.5% a year, at the cost of a slightly lower long–short Sharpe and fewer names per bucket.
Research purposes only. This document reports a historical backtest of the relationship between X (Twitter) sentiment measures and subsequent stock returns. This is not a trading model as results do not include transaction costs. Past results do not indicate future performance.