Below is the out-of-sample cumulative open to close return chart for stocks with extreme sentiment scores prior to market open. As you can see from the chart stocks with high sentiment scores (SMA S-Score > 2) subsequently outperform while stocks with low sentiment scores (S-Score <-2) subsequently underperform. The benchmarks in this chart are the S&P 500 constituents open to close return and all equities with sentiment signals.
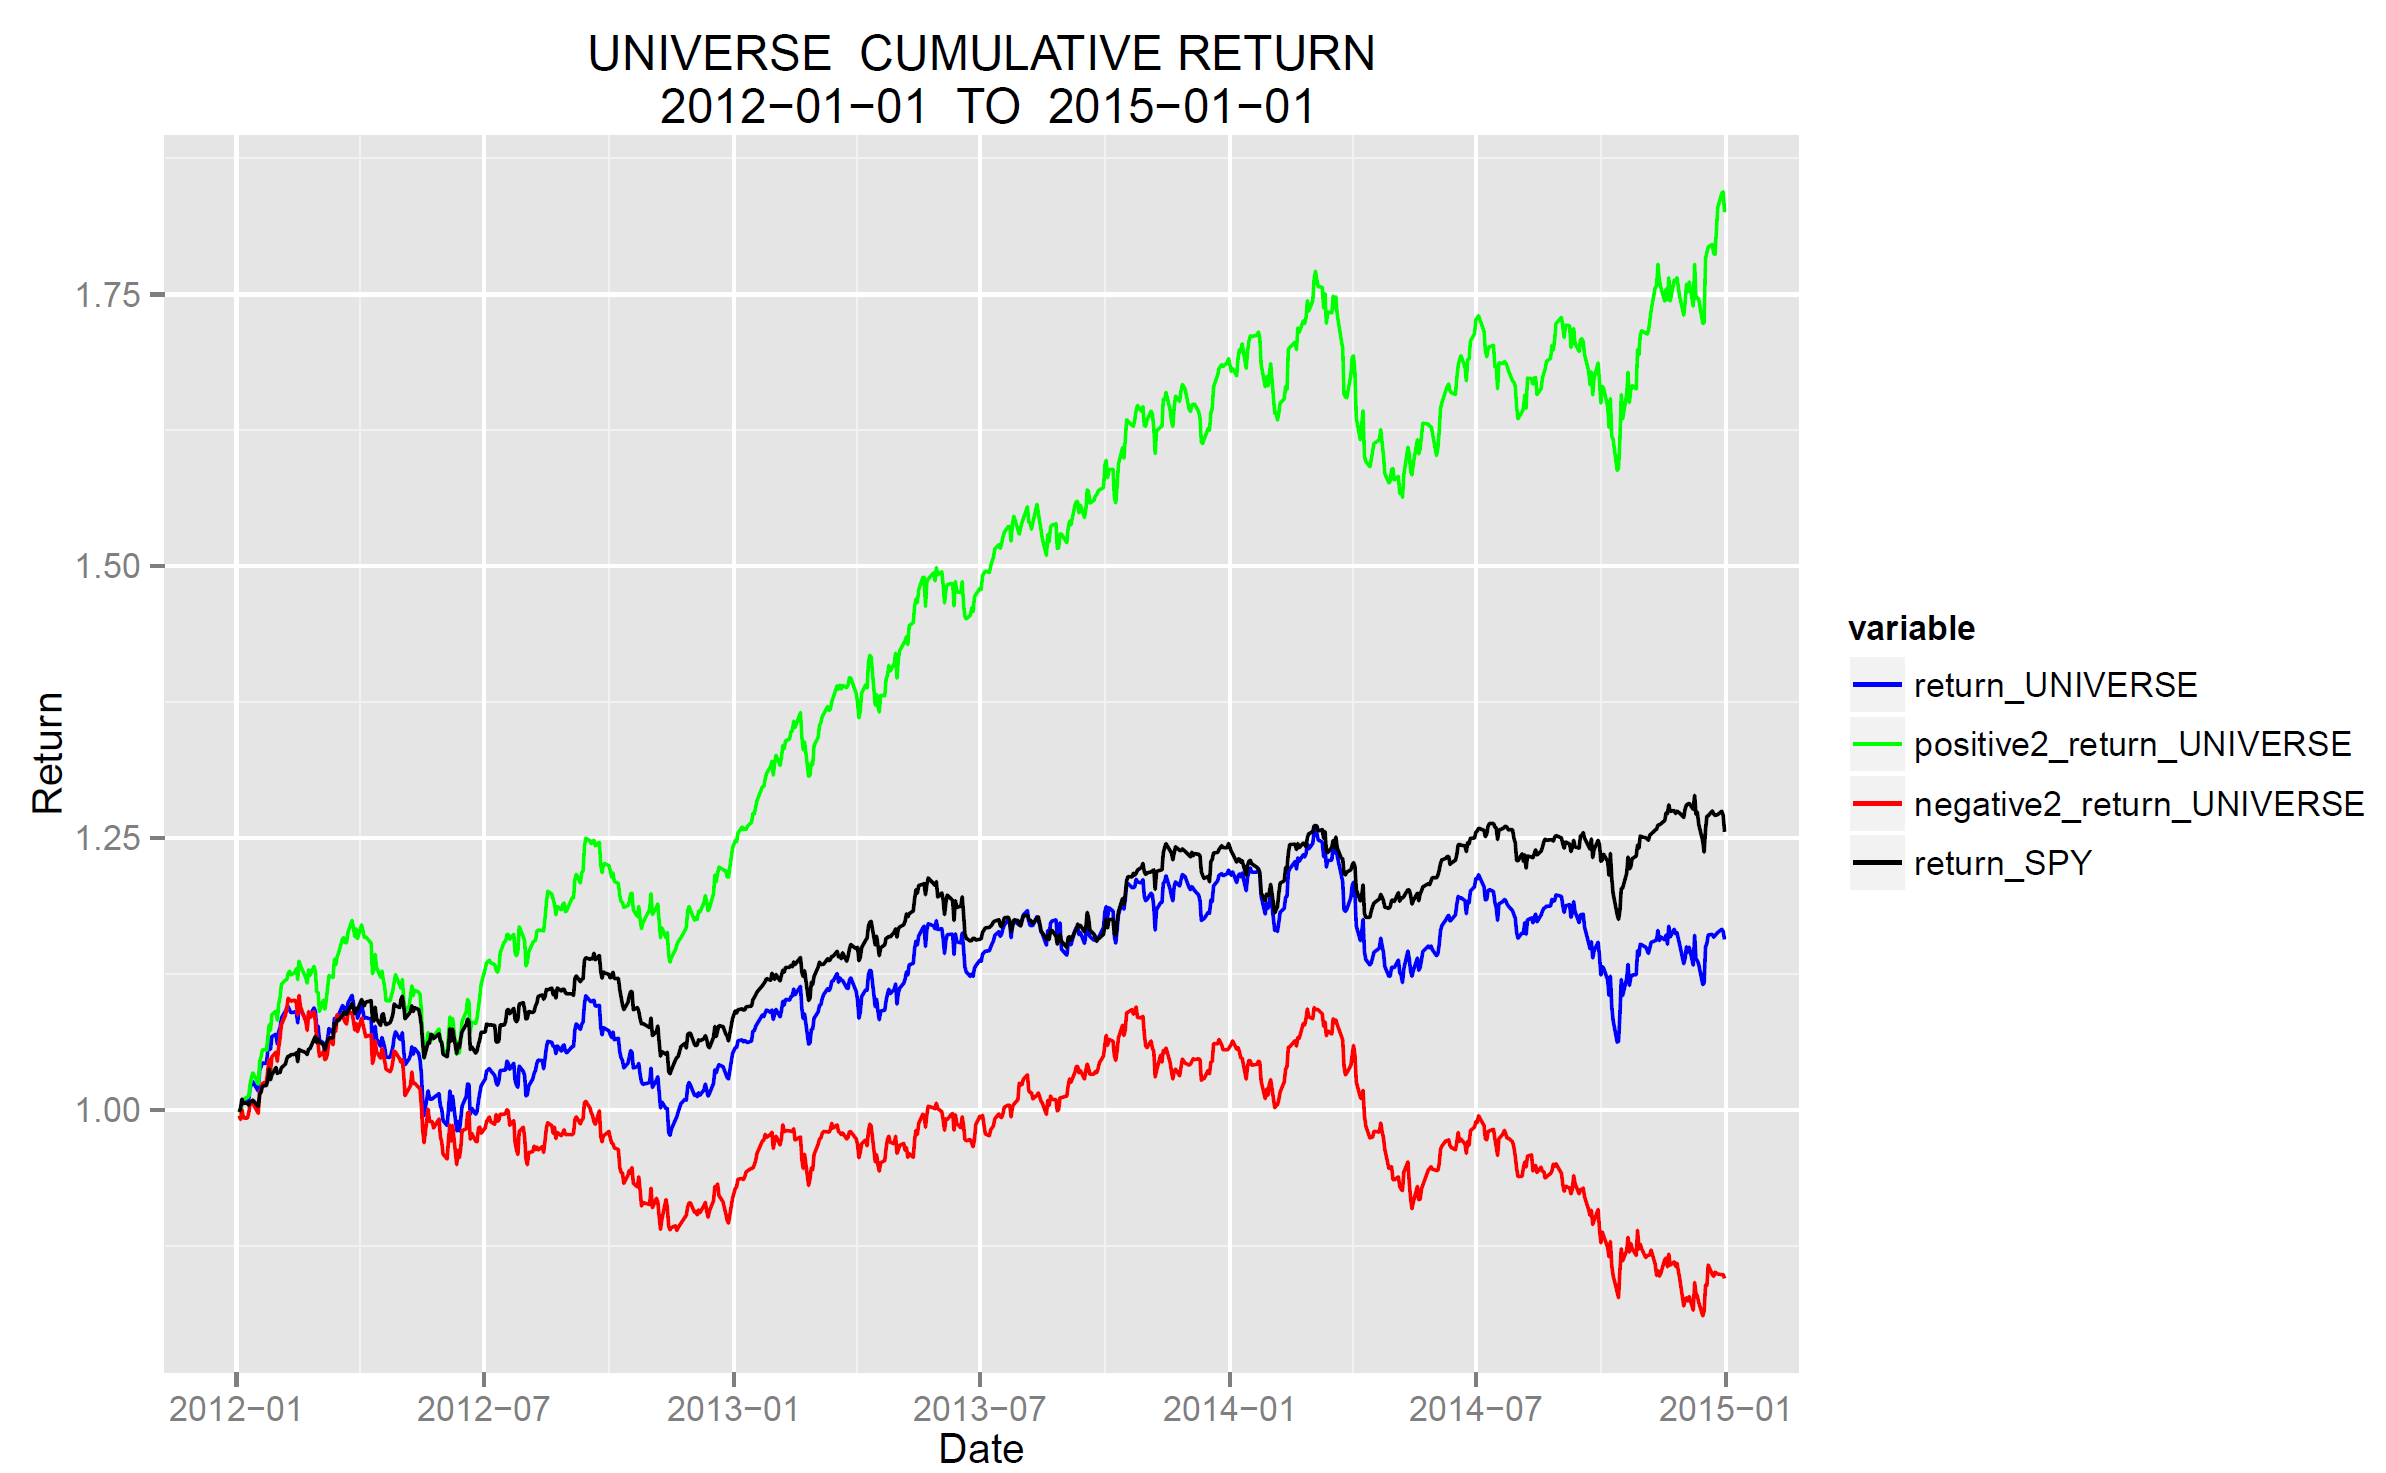
“Are some sectors better than others for social media?” is a question I regularly receive. Like all predictive models some sectors are better than others. Sectors with Business-to-Consumer focus are more predictive because there is more consumer commentary on Twitter in addition to the standard trading and analyst commentary. Below are the cumulative return charts for consumer facing sectors.
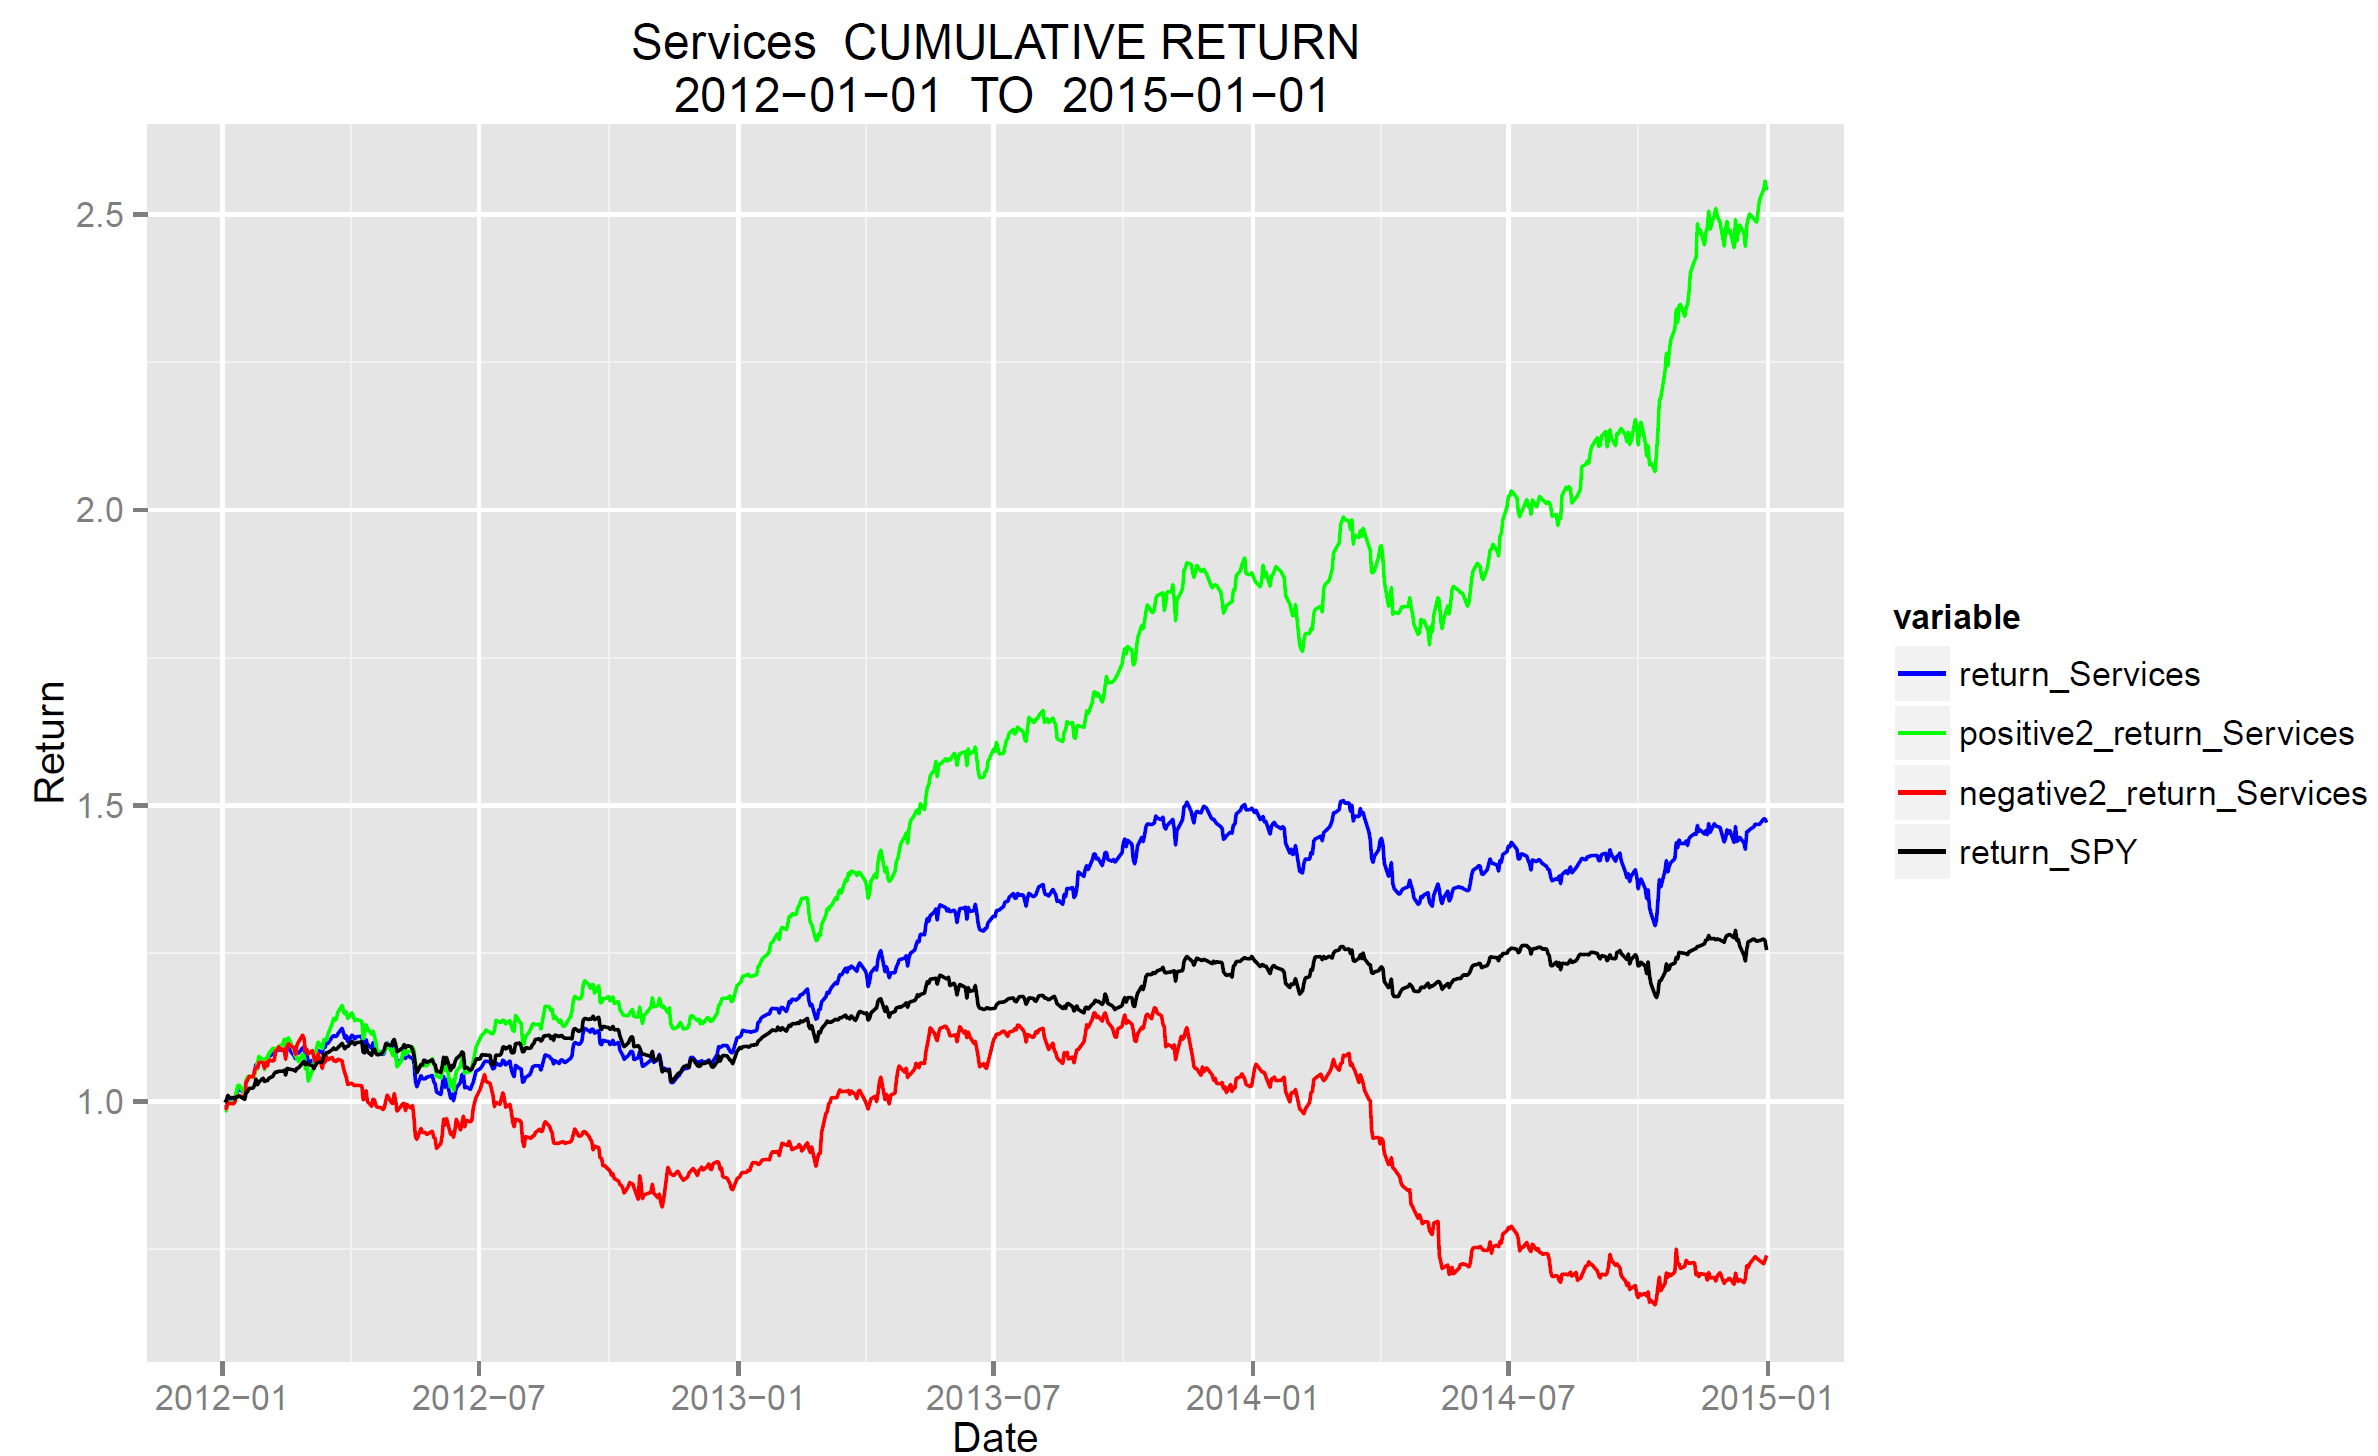
High sentiment stocks in the Services Sector have a subsequent open to close cumulative return of +250 percent since inception of SMA sentiment data. Low sentiment stocks have a subsequent open-to-close return of -50% since inception of SMA sentiment data.

Sentiment data has proven to be very predictive for Consumer Goods. High sentiment stocks in the Consumer Goods Sector have a subsequent open to close cumulative return of +350 percent since inception of SMA sentiment data. Low sentiment stocks have a subsequent open-to-close return of -50% since inception of SMA sentiment data.
SMA is the leader in sentiment for financial markets; we are continuously analyzing our data. Contact me (joeg@contextanalytics-ai.com) to learn more about SMA research on Sector and Industry performance.