People ask about the persistence of SMA sentiment signals over time. The signal length is dependent on the S-Factor used. S-Mean for example represents a 20 day look back period and is generally used as a longer term signal. We looked at a theoretical strategy using a universe of the Russell 1000 and S-Factors: S-Score, S-Volume and price. It is not intended as a proposal of a trading strategy using S-Factors as a single factor in an alpha model it does illustrate the persistence of the signal over time.
We primarily looked at the signal prior to market open instead of prior days close to include the most recent social media conversation in the metrics. If you use a sentiment score from the prior days close you don’t include overnight information such as news, foreign markets, and indication of market open…
The universe of stocks considered is the Russell 1000 representation as of 06/26/2015. The back test period is 2011-12-01 to 2015-11-12. There are no transaction costs/impact costs assumptions included in this analysis.
The simulation uses S-Score > 3 / S-Score < -3 AND S-Volume > 5 AND Price at Entry > $5. An S-Score > 3 means the current conversation is more positive than 99% of conversations over the look back period (20 days). The reason for choosing the threshold of 3 for S-Score is motivated, in part; on research results presented by Markit using the SMA S-Factors (contact us for the research). The position holding period is Open to Close (+2), (i.e. close 2 business days from now). The S-Factors signals used were selected at 09:10 AM (ET).
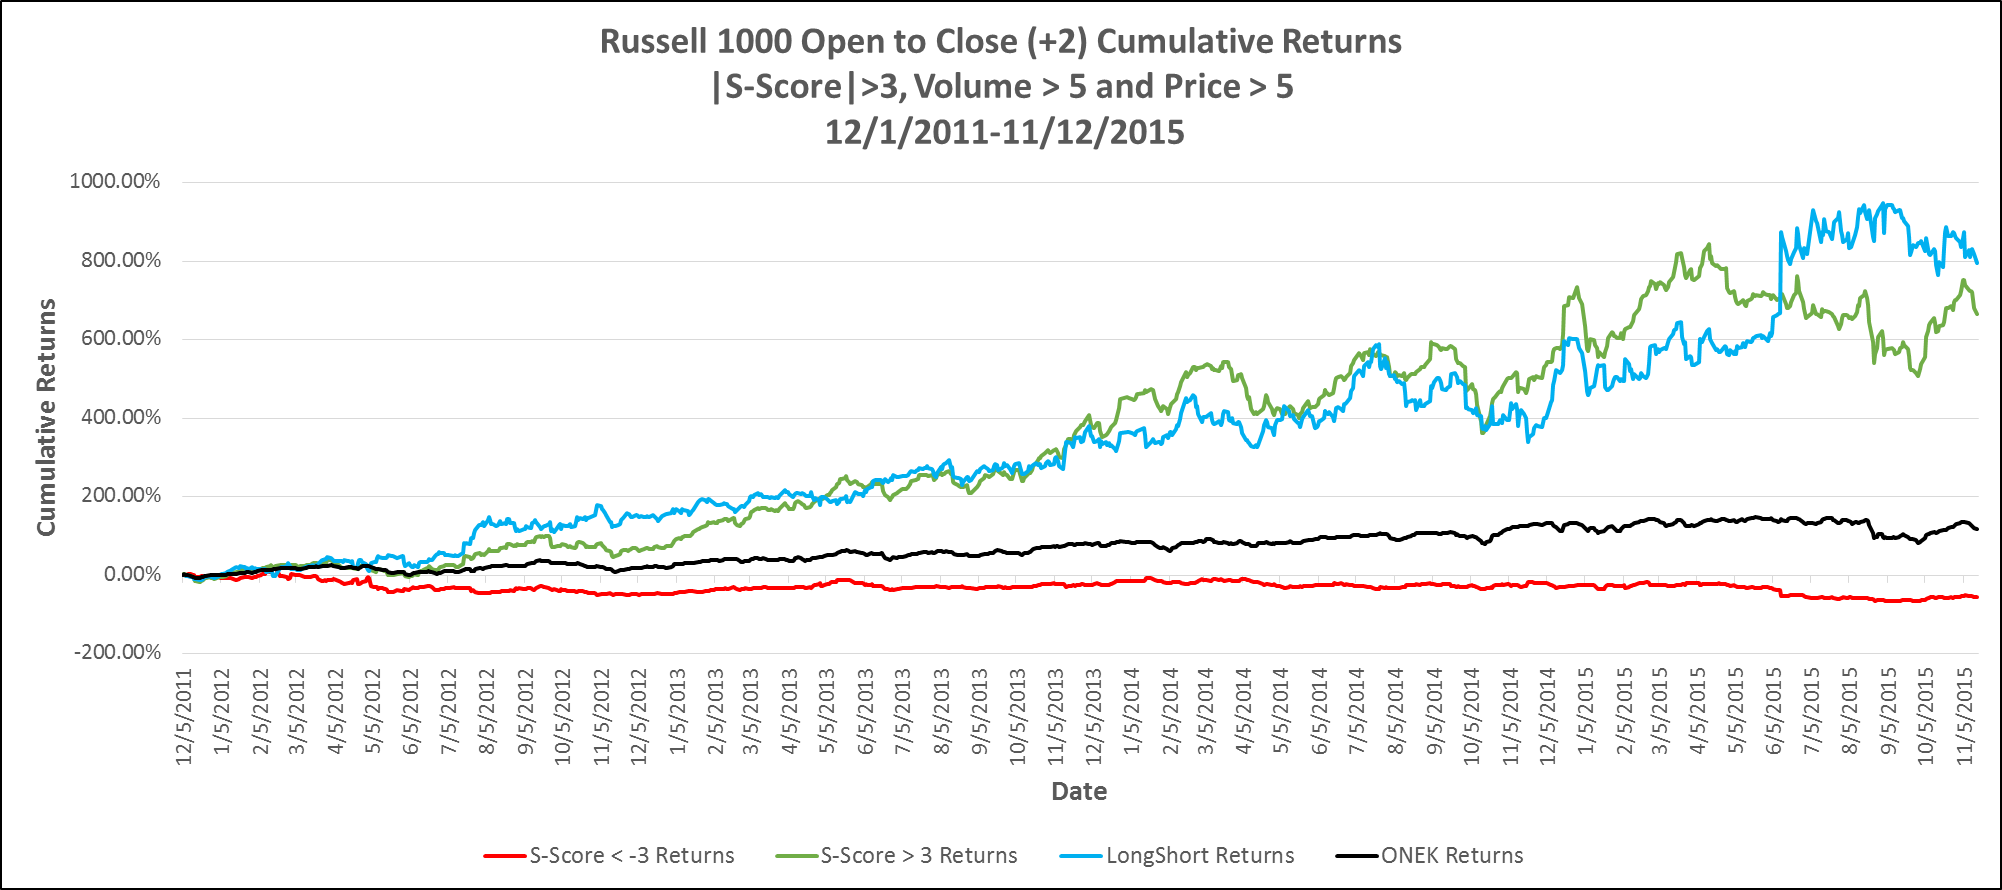
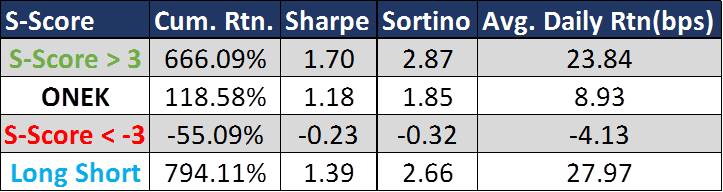
In the below chart, the Green Curve shows the results of going long on Positive Signal (S-Score positive with the thresholds used). Similarly, the Red Curve shows the returns of the negative (S-Score <-3, negative return is good in this case). The Blue Curve is the result of going long on Positive Signal Portfolio and short the Negative Signal Portfolio each day. Black Curve is the ONEK ETF (Russell 1000 SPDR ETF) and serves as a market reference for the back test period. Risk adjusted performance measures (Sharpe, Sortino) and average daily returns are presented for each filter.
The results of Open to Close (+2) Strategy using |S-Score|> 3 & S-Volume > 5 & Entry Price > $5 signal at 09:10 AM are below. To test the strength of a signal with strong threshold, we decided to hold the position for 3 days, (buying at the open when the signal met requirements of the filter and selling it at the close 2 business days later). If a stock appears on 2 consecutive days, the trades are made in isolation, irrespective of the position that is held due to previous signal. The Positive and Long Short outperform the ONEK benchmark. A large spread between Positive results and the benchmark is evident.
In our simulation the positive S-Score portfolio returns 23 bps per day versus the benchmark of 9 bps per day. The long/short portfolio returns 28 bps versus the 9 bps per day for the benchmark. Certainly significant reason for further analysis of adding sentiment signals to your portfolio.
These results illustrate that adding S-Volume and price filters, in conjunction with S-Score, yields significant positive returns performance.
Please contact us for much more detail and other back test or to explore how sentiment metrics can be used in your environment.