Social Market Analytics (SMA) aggregates the intentions of investors as expressed on the StockTwits platform. SMA creates proprietary S-Factor metrics that quantitatively describe the current conversation relative to historical benchmarks. This data provides strong predictors of future price movement. This blog will focus on the deterministic nature of the StockTwits data set when aggregated into SMA S-Factors. StockTwits is a community for active traders to share ideas enabling you to tap into the pulse of the market: http://stocktwits.com/
The charts and tables below illustrate the subsequent open to close return of stocks that are being spoken about abnormally positively or abnormally negatively on StockTwits twenty minutes prior to market open. Sharpe and Sortino ratios for the theoretical portfolios are included as well. The SMA S-Score looks at the current conversation relative to historical benchmarks and creates effectively a Z-Score.
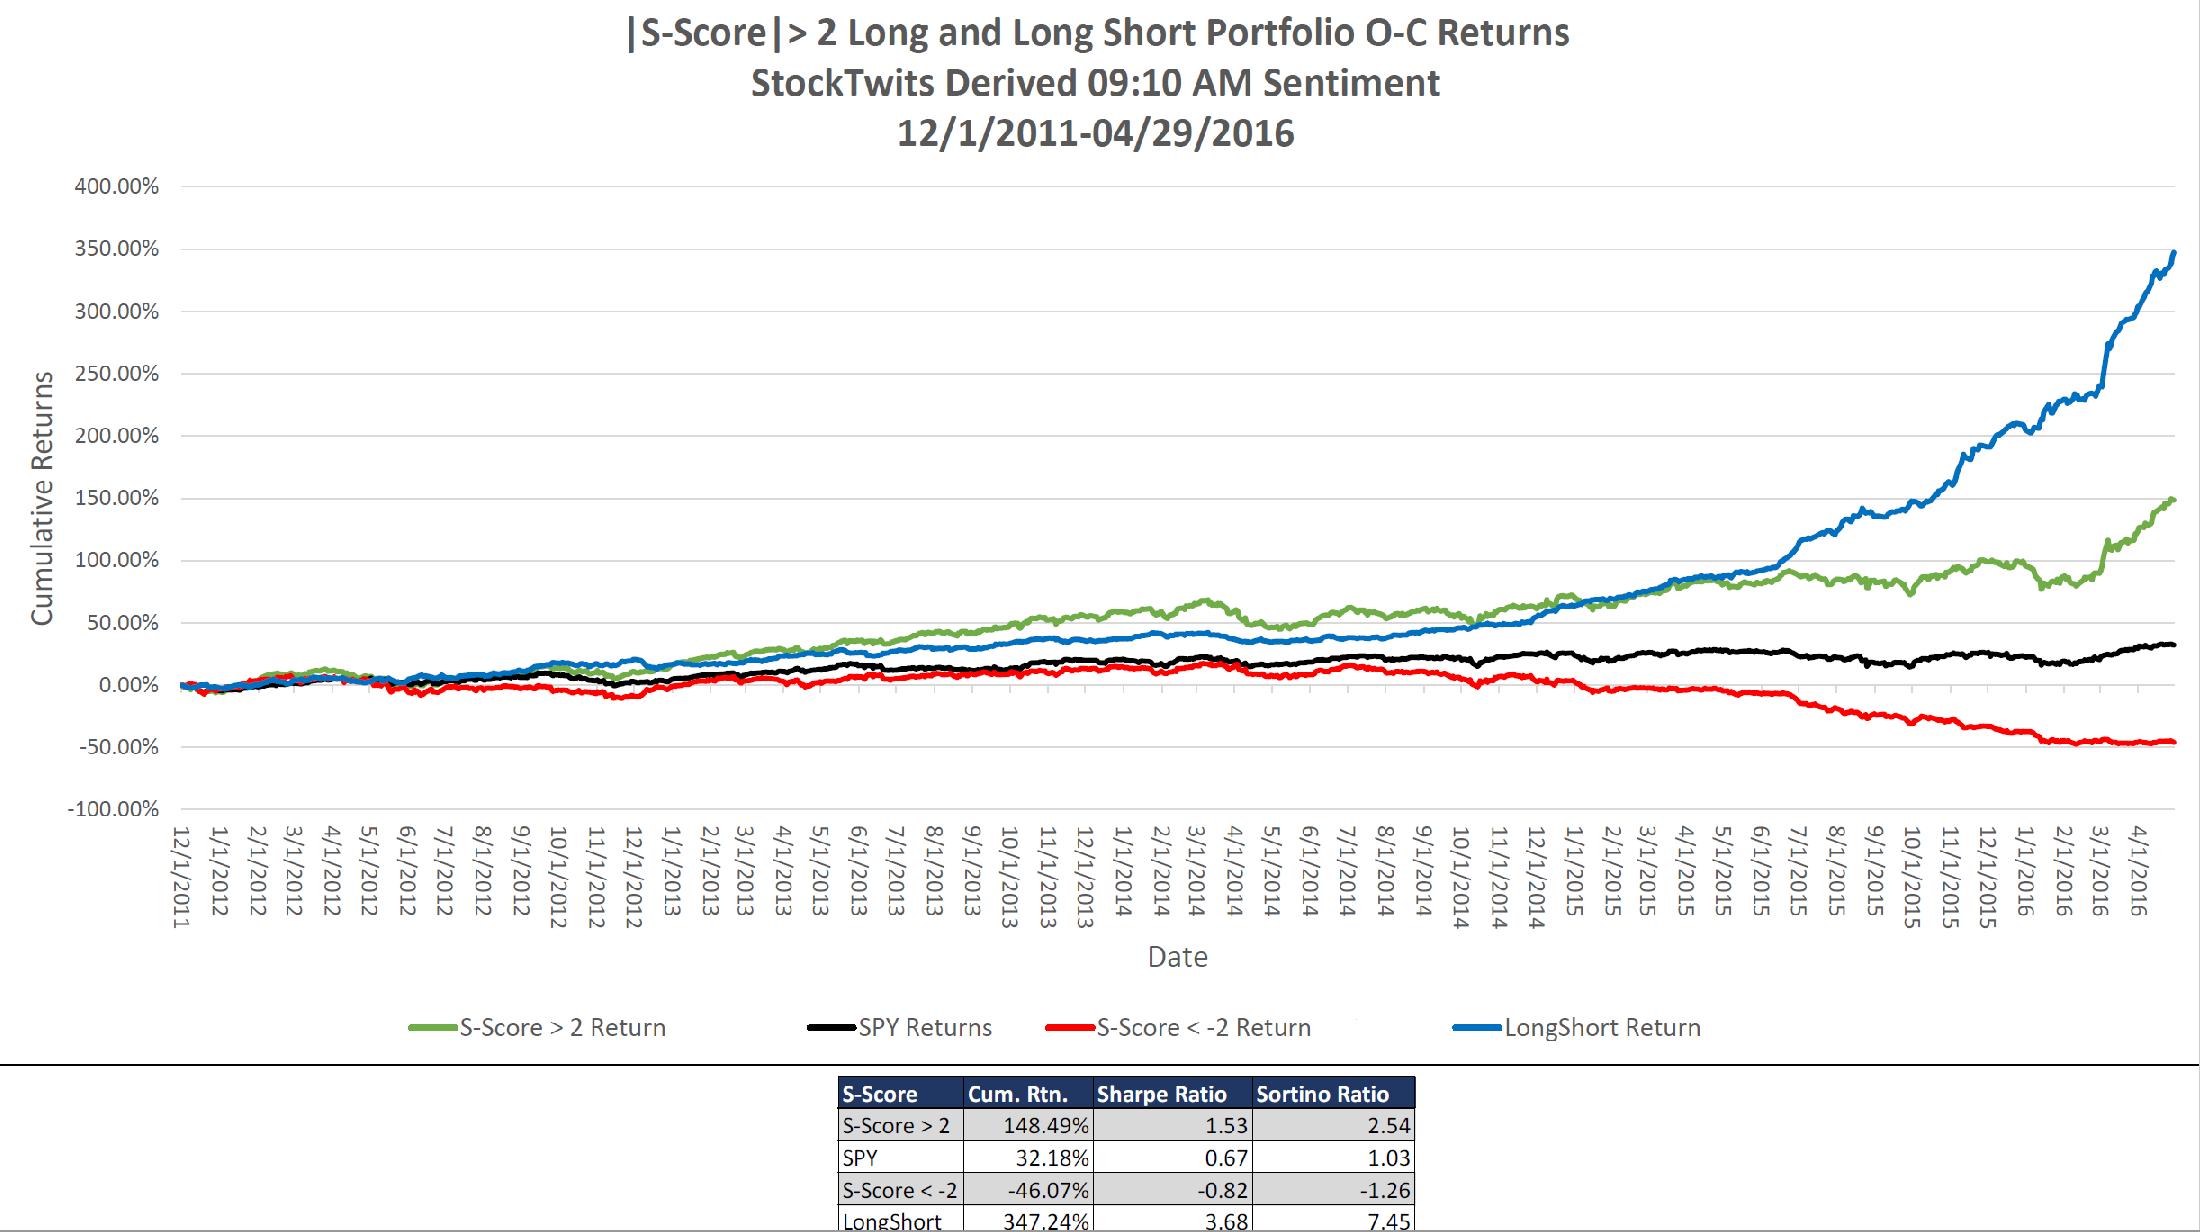
The Green line below is an index of subsequent open to close return of stocks with abnormally positive conversations on StockTwits prior to the market open. The Red line is an index of the subsequent open to close return of stocks with an abnormally negative conversation prior to market open. The black line represents the market open to close return and the blue line represents a theoretical long/short portfolio.
These charts clearly illustrate the predictive information present in the StockTwits message stream. If there was no predictive power in the StockTwits data set the Green, Red, and Black lines would be nearly identical -statistically not the case. These signals are available at 9:10 am Eastern time well before the market open.
The chart below looks at the full SMA history of StockTwits based S-Factors. The theoretical long portfolio has a Sharpe Ratio of 1.53, theoretical short portfolio -.82 Sharpe and LS portfolio has a Sharpe of 3.68. Sortino Ratios are above one as well. There is strong predictive power in this data.
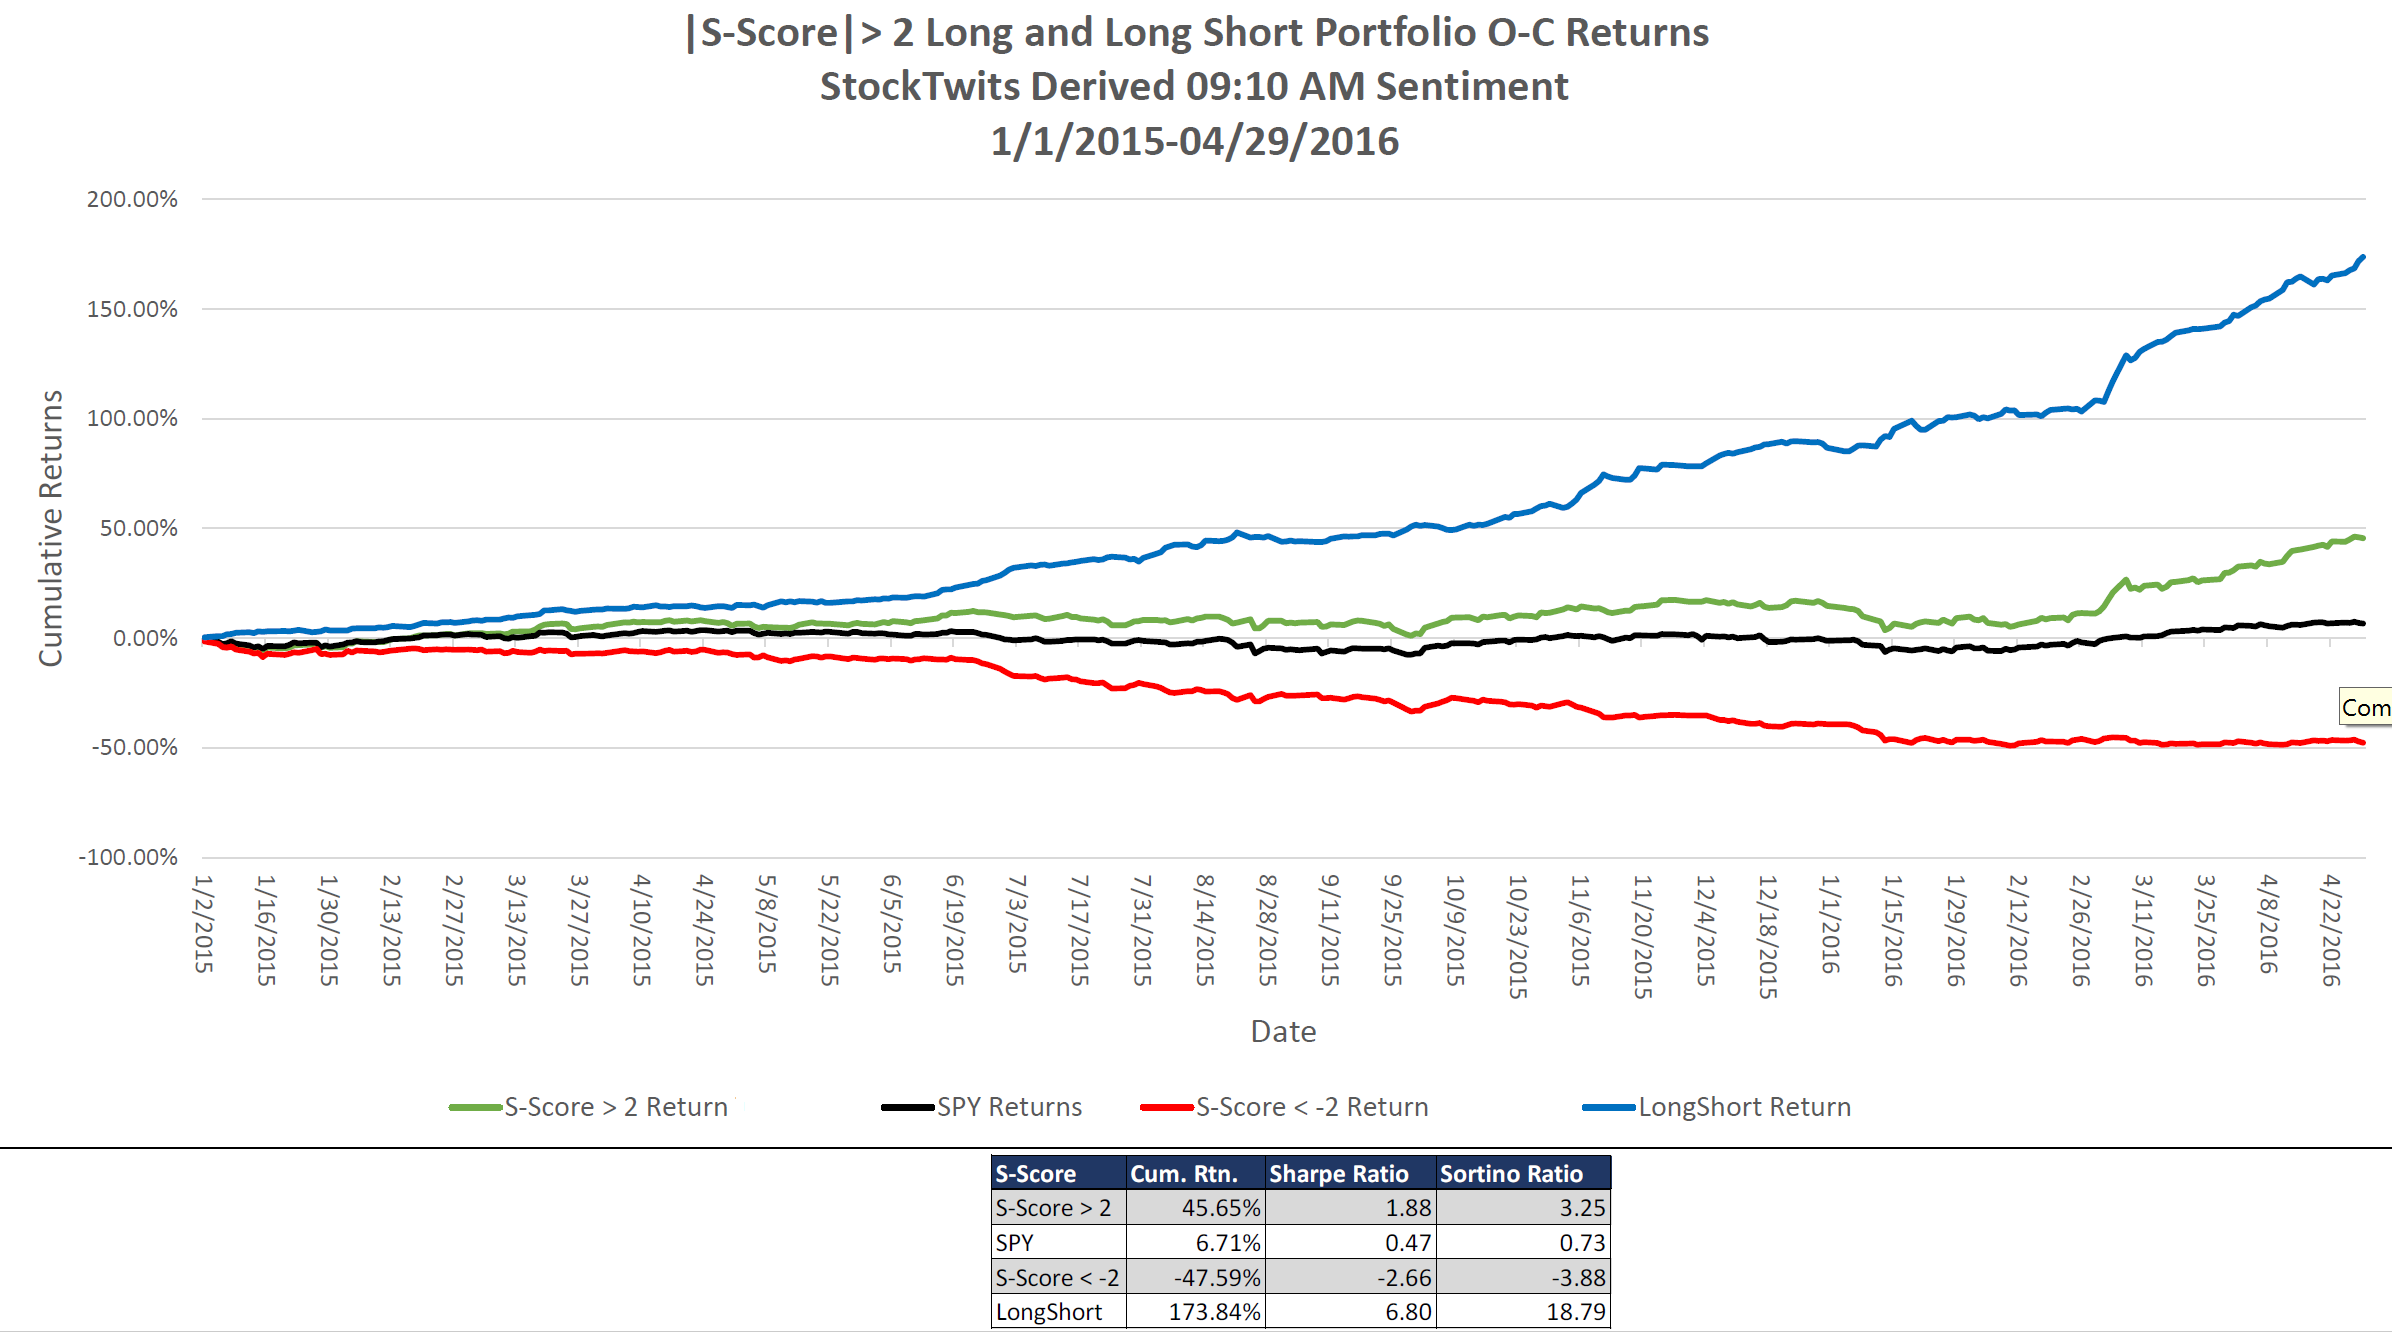
The last year has been particularly challenging for the Hedge Fund community. Below is a chart with the performance of the theoretical portfolios broken out from 1/1/2015 to current. As you can see these portfolios performed well in this volatile market period.
For more information on these data sets please contact Pierce Crosby: (pierce@stocktwits.com) or Joe Gits: (joeg@contextanalytics-ai.com)
Regards,
Joe