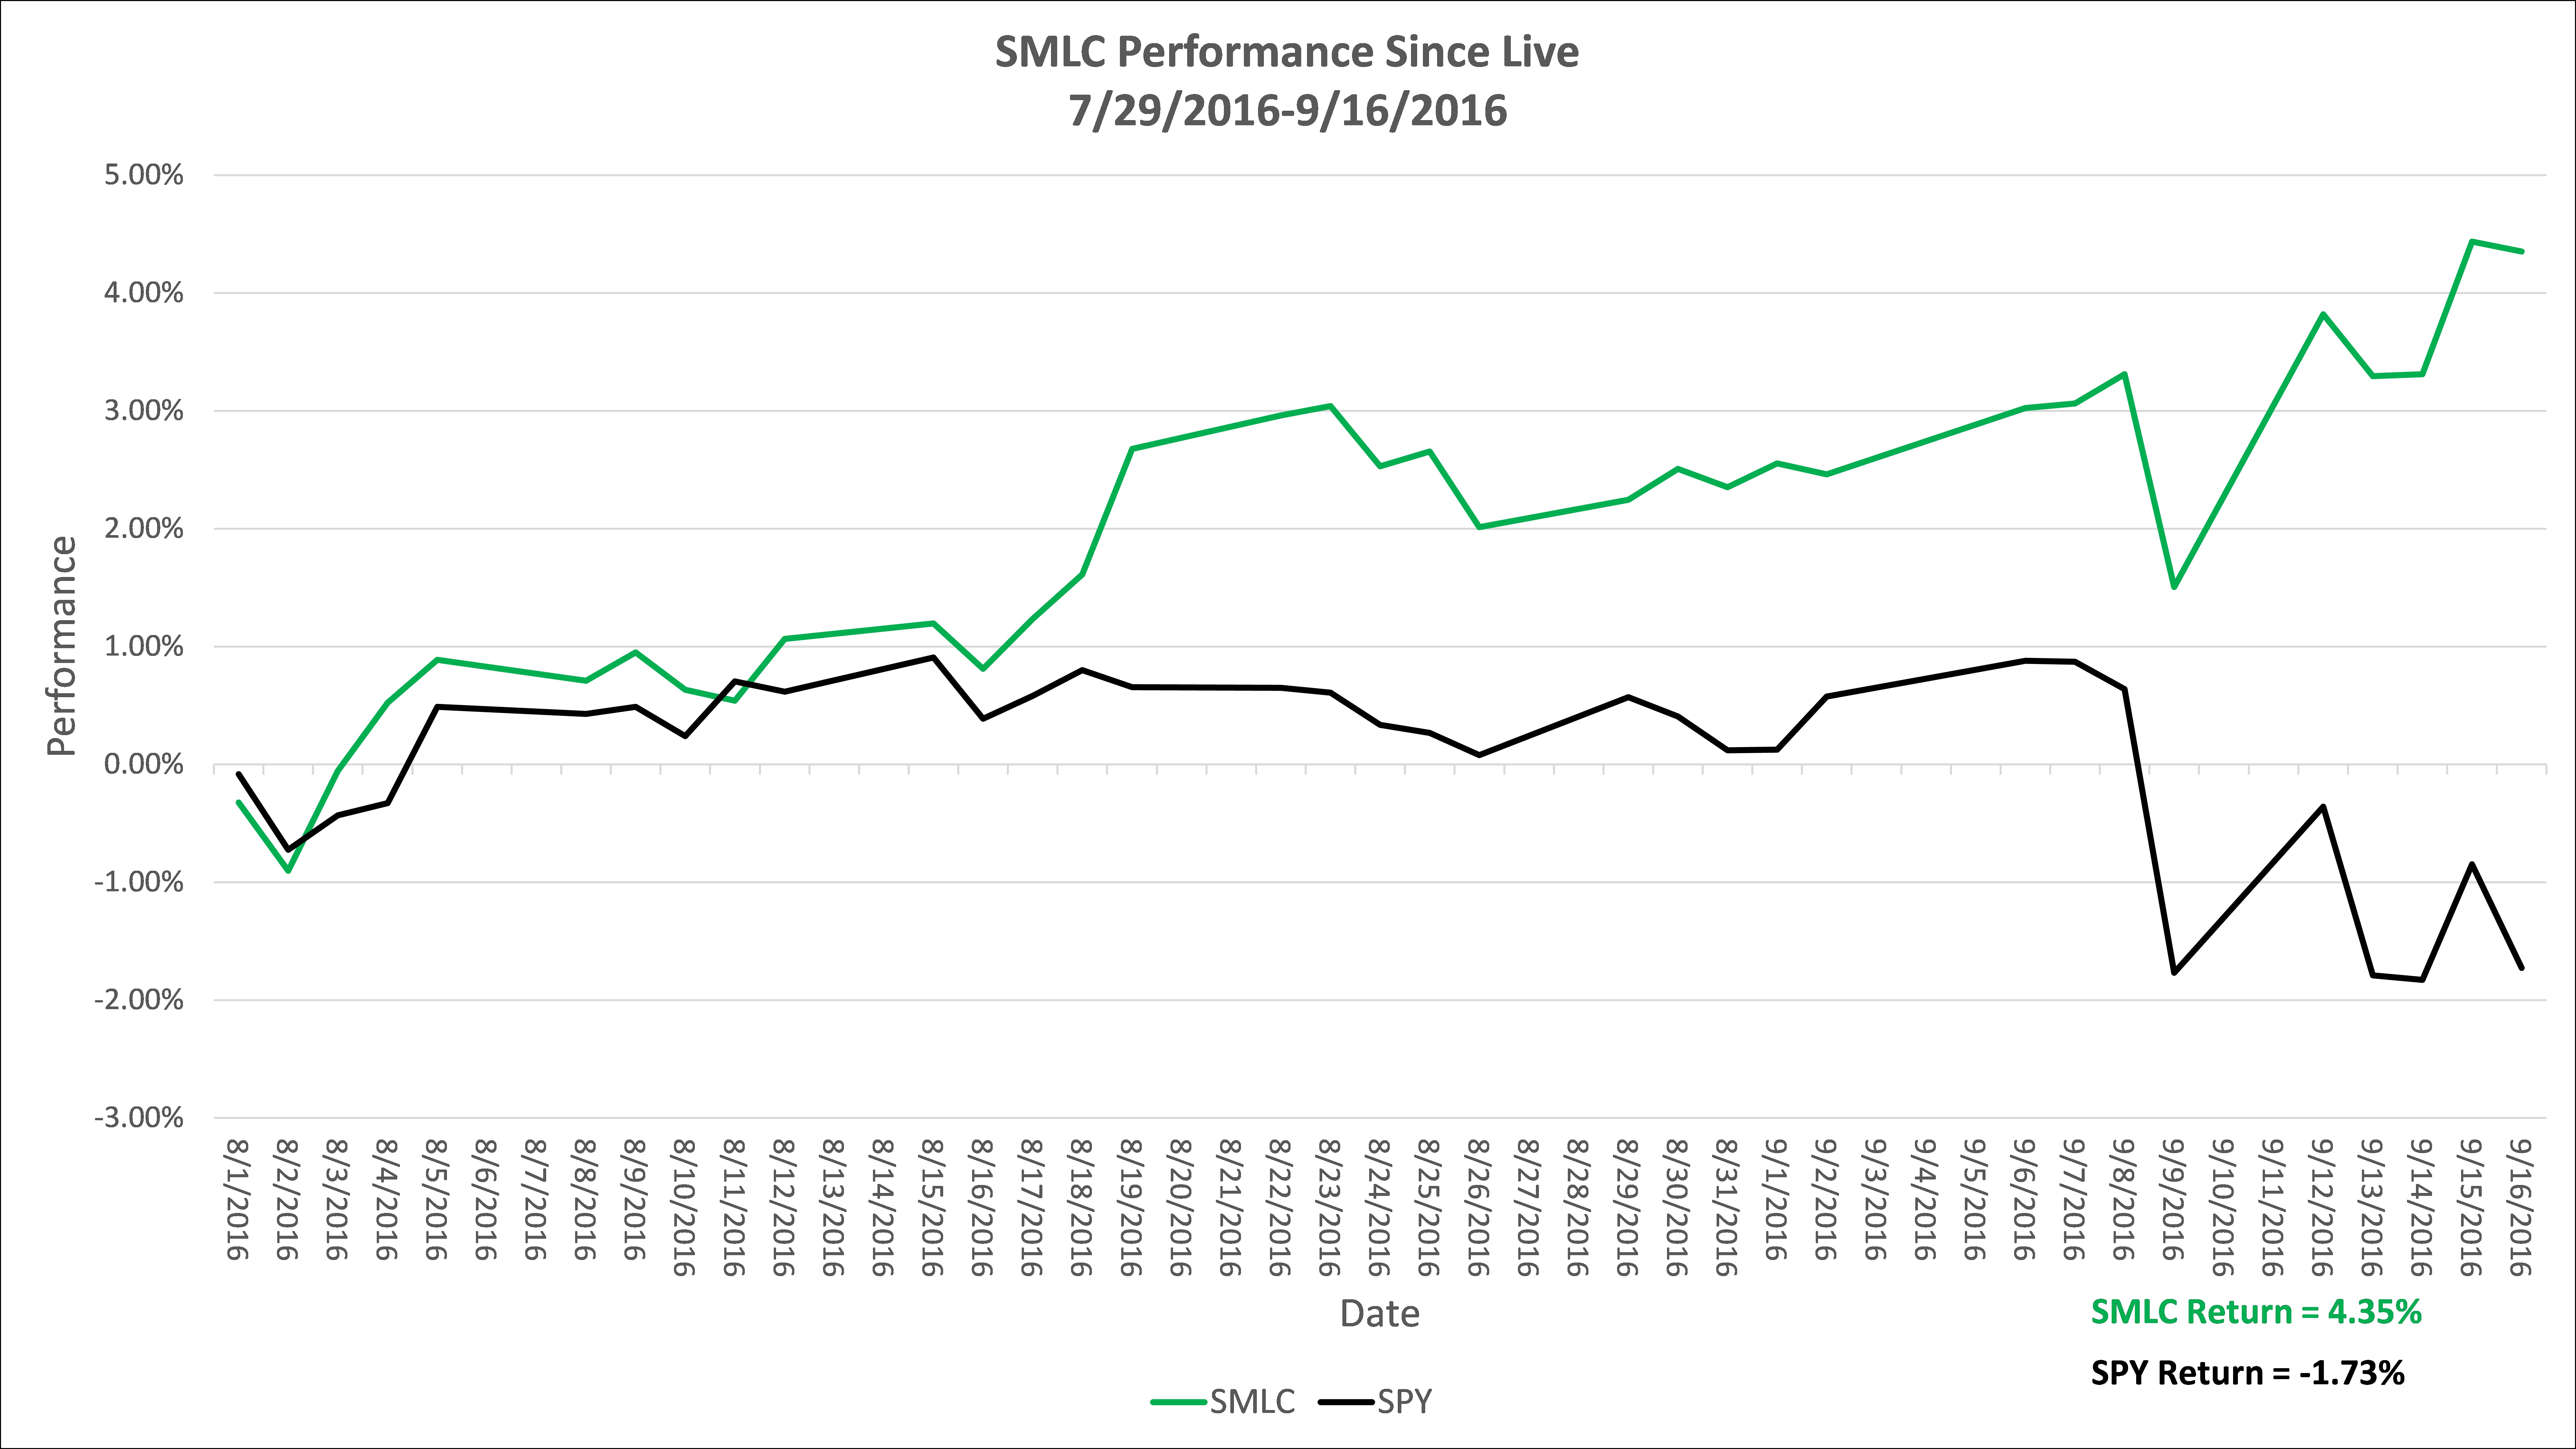
Since SMLC launched six weeks ago there has been a significant increase in volatility. I thought it would be interesting to see how SMLC has performed during this period of increased volatility. The chart below shows the cumulative return of SMLC versus the S&P500 over the same period. Factors derived from the rigorous cleansing and analysis of social media data can provide an edge in the market even during periods of increased volatility. SMLC is composed of the highest S-Score stocks from the CBOE Large Cap Universe prior to market open. To learn more about SMLC or the SMA S-Factors please contact Social Market Analytics. SMLC is up 4.35 percent since inception and the SP is down 1.73 percent over the same period.