Since our founding in 2012 we have been acquiring out-of-sample history to use in development of factor models. We now have five years of history, with this history we can create statistically significant signals with monthly and quarterly holding periods.
This blog will explore the use of sentiment data for monthly and quarterly holding periods. A trading system is explored by looking at exhaustion in social media measured by acceleration and velocity of sentiment as an indicator of price movements. My next blog will look at traditional monthly and quarterly holding period performance based on a multi-factor sentiment model.
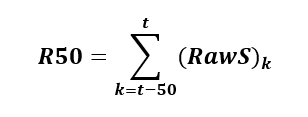
Acceleration and velocity metrics can identify shifting sentiment. To build these metrics, we created a new 50 period signal in addition to our traditional 20 day signal. Raw-S is the net sentiment over a 24-hour look back period from a point of observation, derived from Tweets captured during the look back period. By aggregating over 50 periods, we create a 50-period Raw-S we call R50 as follows,
For the purpose of this blog, we use 3:40 PM US Eastern Time factors to create the new metrics. At 3:40 PM US Eastern, a signal is generated near Market Close but with enough time to enter trades and execute at the Close. All trades reported in this paper are assumed to be executed at the Closing price of the day.
The R50 Factor is a raw 50 period sentiment measure. To normalize the factor, we compute a standardized measure, using the following formula,
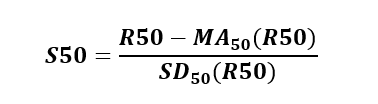
where,
S50 is the Z-Score of R50
MA50 (R50) is 50-day moving average of the R50
SD50 (R50) is 50-day moving standard deviation of R50
S50 is a way to represent the R50 raw sentiment estimate on a standard normal curve.
We want to identify when the sentiment trend changes direction. We derive new Velocity and Acceleration metrics from the S50 factor to identify changes in long-term sentiment and the rate of change of long-term sentiment.
We define V50, the velocity, as the one period change in S50,
![]()
In our research, the velocity and the rate of change of velocity are equally important in identifying the exhaustion of a sentiment trend.
We call the rate of change of velocity, the acceleration, A50, (the second derivative of the S50),
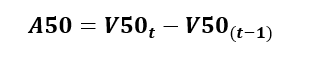
We observed a mean reverting phenomenon with longer-term sentiment. A high positive peak in the S50 sentiment was typically followed by a decrease in price. Consequently, a local minimum of S50 was followed by price appreciation.
This is the foundation of the trading signals developed.
We used various portfolio sizes to test this trading strategy. Portfolios ranged from 20 highly followed stocks on Twitter to the full SMA equity universe.
Using the metrics defined above, we used the following entry and exit signals,
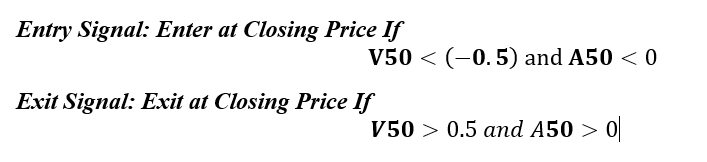
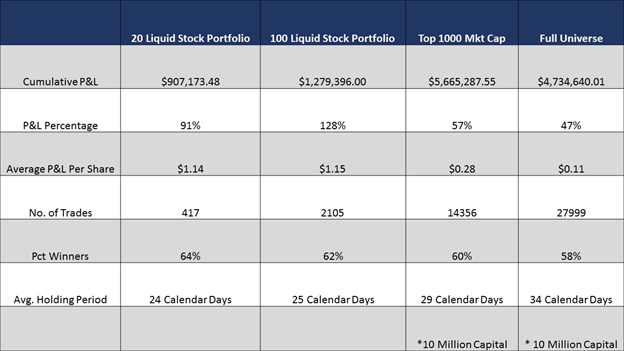
This was a successful trading strategy across all universes selected. Below are performance statistics for various universe sets. 20 liquid stock portfolio universe is a universe of stocks that are highly followed on Twitter. 100 liquid stock universe is a universe of 100 stocks that are highly followed on Twitter. Top 1000 mkt. cap and universe are self-explanatory.
This data is statistically significant, out of sample, and reproducible. To learn more about the possibilities of sentiment data in your model please contact SMA at ContactUs@SocialMarketAnalytics.com.
Thanks,
Joe