As we move into a new year Social Market Analytics (SMA) has acquired five years of out-of-sample data. This real history has enabled us to build signals for longer holding periods. In this blog we will explore the use of SMA data for weekly, monthly and quarterly holding periods.
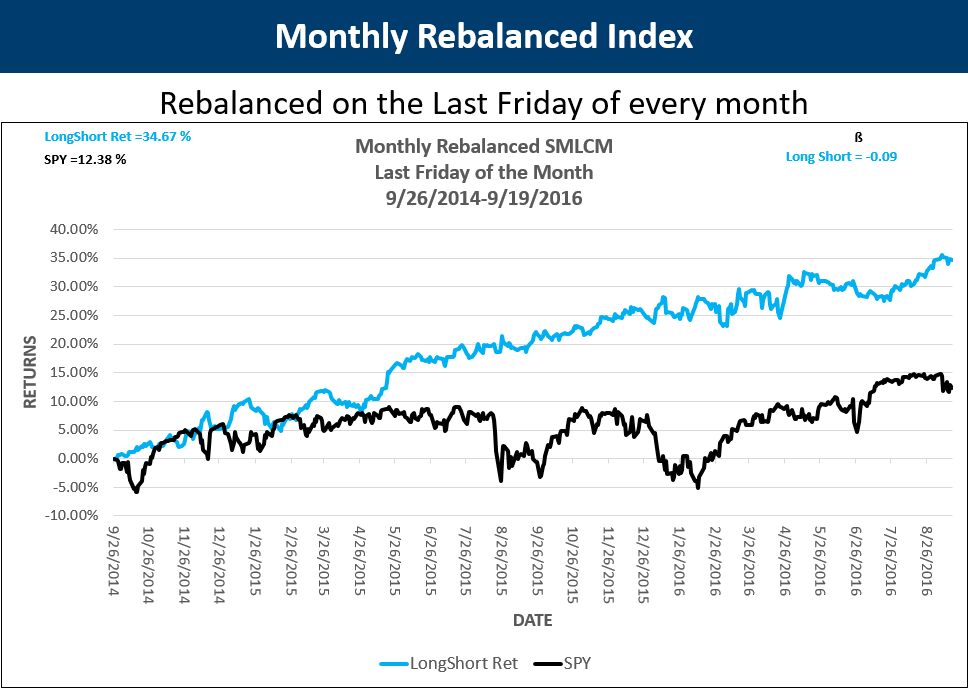
Portfolio managers often re-select securities for their portfolios at set re-balance periods. These periods can be weekly, monthly quarterly, yearly…. As we accumulate history we are able to create factors with longer term statistical significance. Longer term for SMA means monthly and quarterly. For these longer holding period portfolios we created a three factor model using Raw-S, SV-Score and S-Buzz. These factors look at sentiment, levels of volume relative to normal conversations for that security and relative to the entire universe. Historical baselines for these securities have been extended to 50 and 200 days. These three factors are combined into a multi-factor score and the top and bottom stocks are selected for long, short, and a theoretical long/short portfolio. Returns of these theoretical portfolios are below.
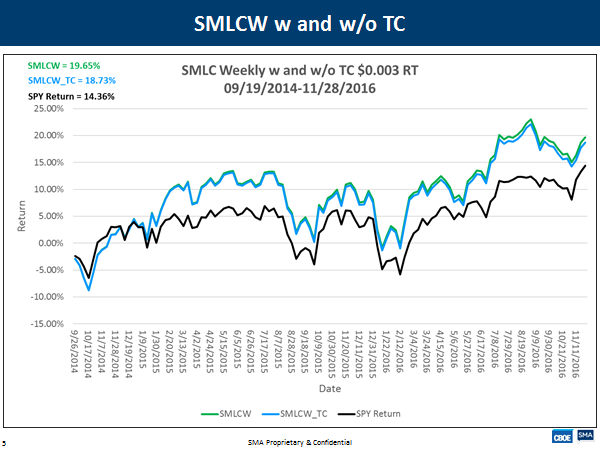
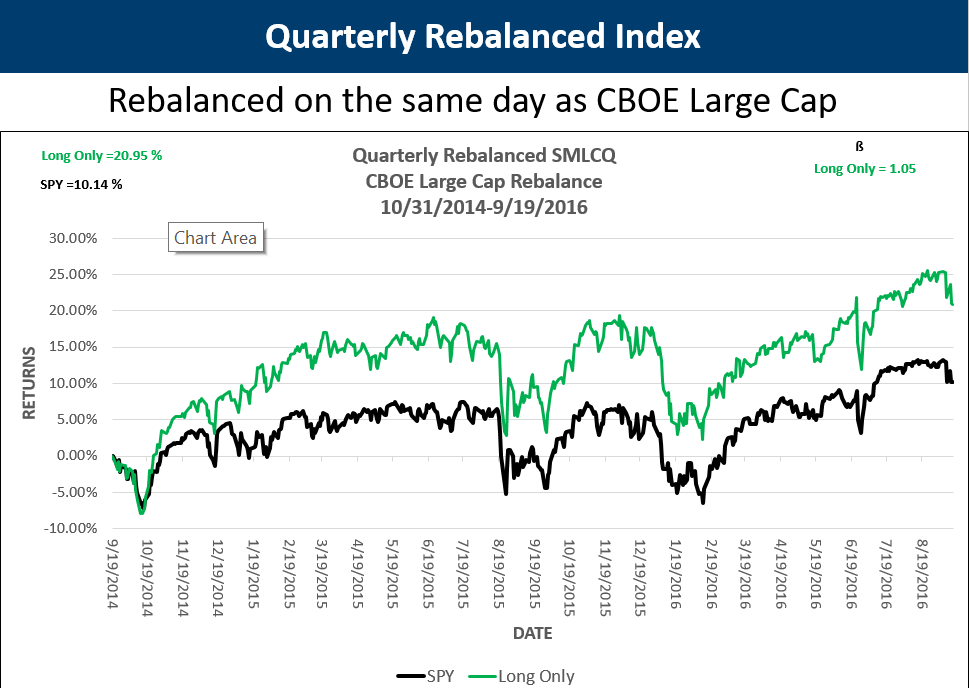
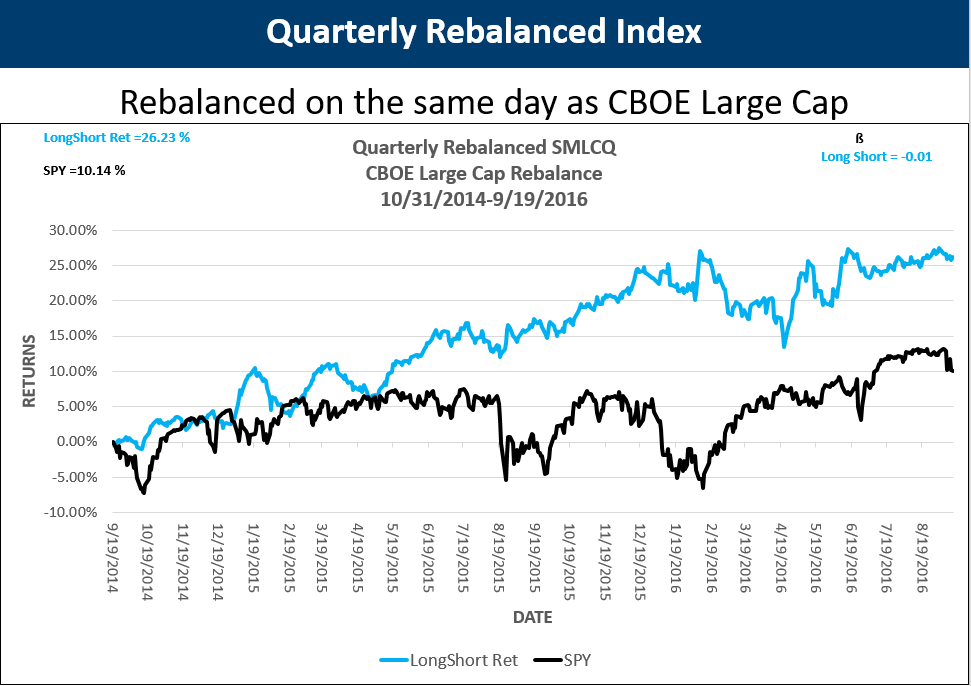
Each portfolio is selected from a universe of the largest 450 stocks that trade options on the CBOE. SPY is the benchmark in each chart. As you can see each portfolio significantly outperforms the SPY. Each chart shows returns. Monthly and quarterly show the diversification benefit of sentiment data by displaying beta.
Weekly returns with and without transaction cost versus SPY.

Quarterly Rebalance portfolio.
There is significant predictive power in sentiment data over longer holding periods. SMA is unique in that we have been collecting this data for five years. Our data is free of survivorship and look ahead bias in the Tweets and universe.
For more information please contact SMA at ContactUs@SocialMarketAnalytics.com