The CME Group has partnered with Social Market Analytics, Inc. (SMA) on the CME Active Trader platform to provide predictive sentiment data analytics across six asset classes and thirty-six commodities. The CME Group is leveraging SMA’s Patented processing technology in machine learning and natural language processing (NLP) to provide users with new alternative sentiment data to a trader’s tool kit.
The CME Active Trader cover six asset classes: Equity Index, Energy, Metals, Interest Rates, FX, and Agriculture. Traders can now add Sentiment to their tool kits to decide when to enter and exit positions, hedge or spread, and as a factor in best execution practices.
Over the past several years, social media sources like Twitter are being used more frequently to distribute company news, information, and analysis of Futures and Options. There are 800 Million Tweets a Day across the globe. Social media often raises awareness of news and information more quickly than traditional news sources. SMA is the leader in social media predictive data analytics using forward looking Tweets.
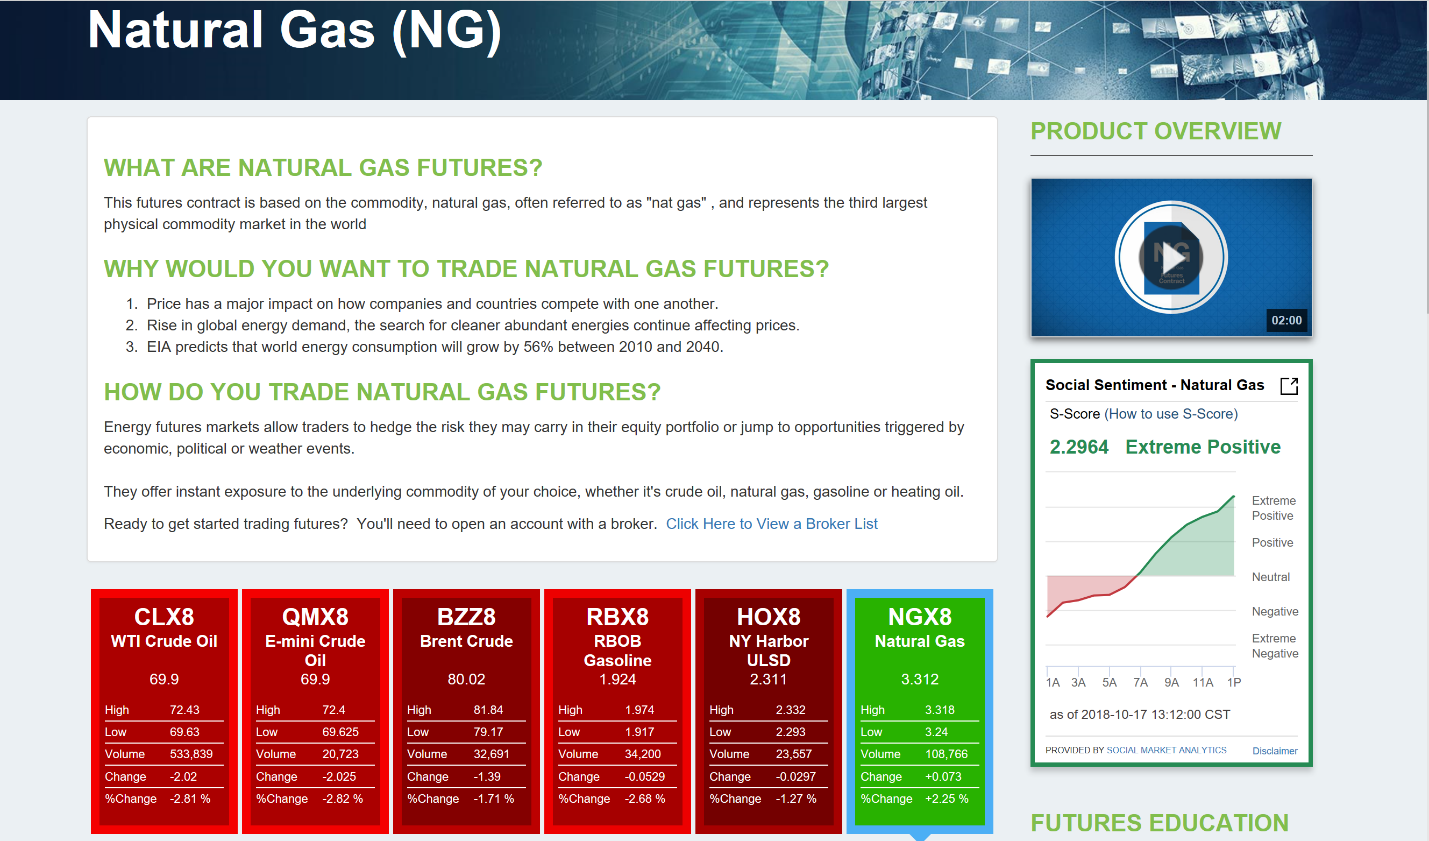
Social Sentiment is measured by the S-Score calculated by Social Market Analytics, Inc. What is S-ScoreTM? The S-Score uses Patented machine learning, natural language processing and account rating algorithms to produce predictive metrics in real time. The S-Score is expressed as deviation from normal tone of conversation on a standard normal scale of -4.5 to +4.5. An S-Score of -2.0 or +2.0 represent that the conversation is 98.6% more negative or positive over the past 24 hours compared to a 20-day baseline. Values around 0 can be interpreted as conversation sentiment same as the past 20 days. Any value above 0 represent a positive deviation as compared to last 20 days and values below 0 represent the conversations turning negative. At levels above +2 and below -2, conversations become statistically significant and the securities start seeing movement in the direction of sentiment over the next 1 hour to 1 day.
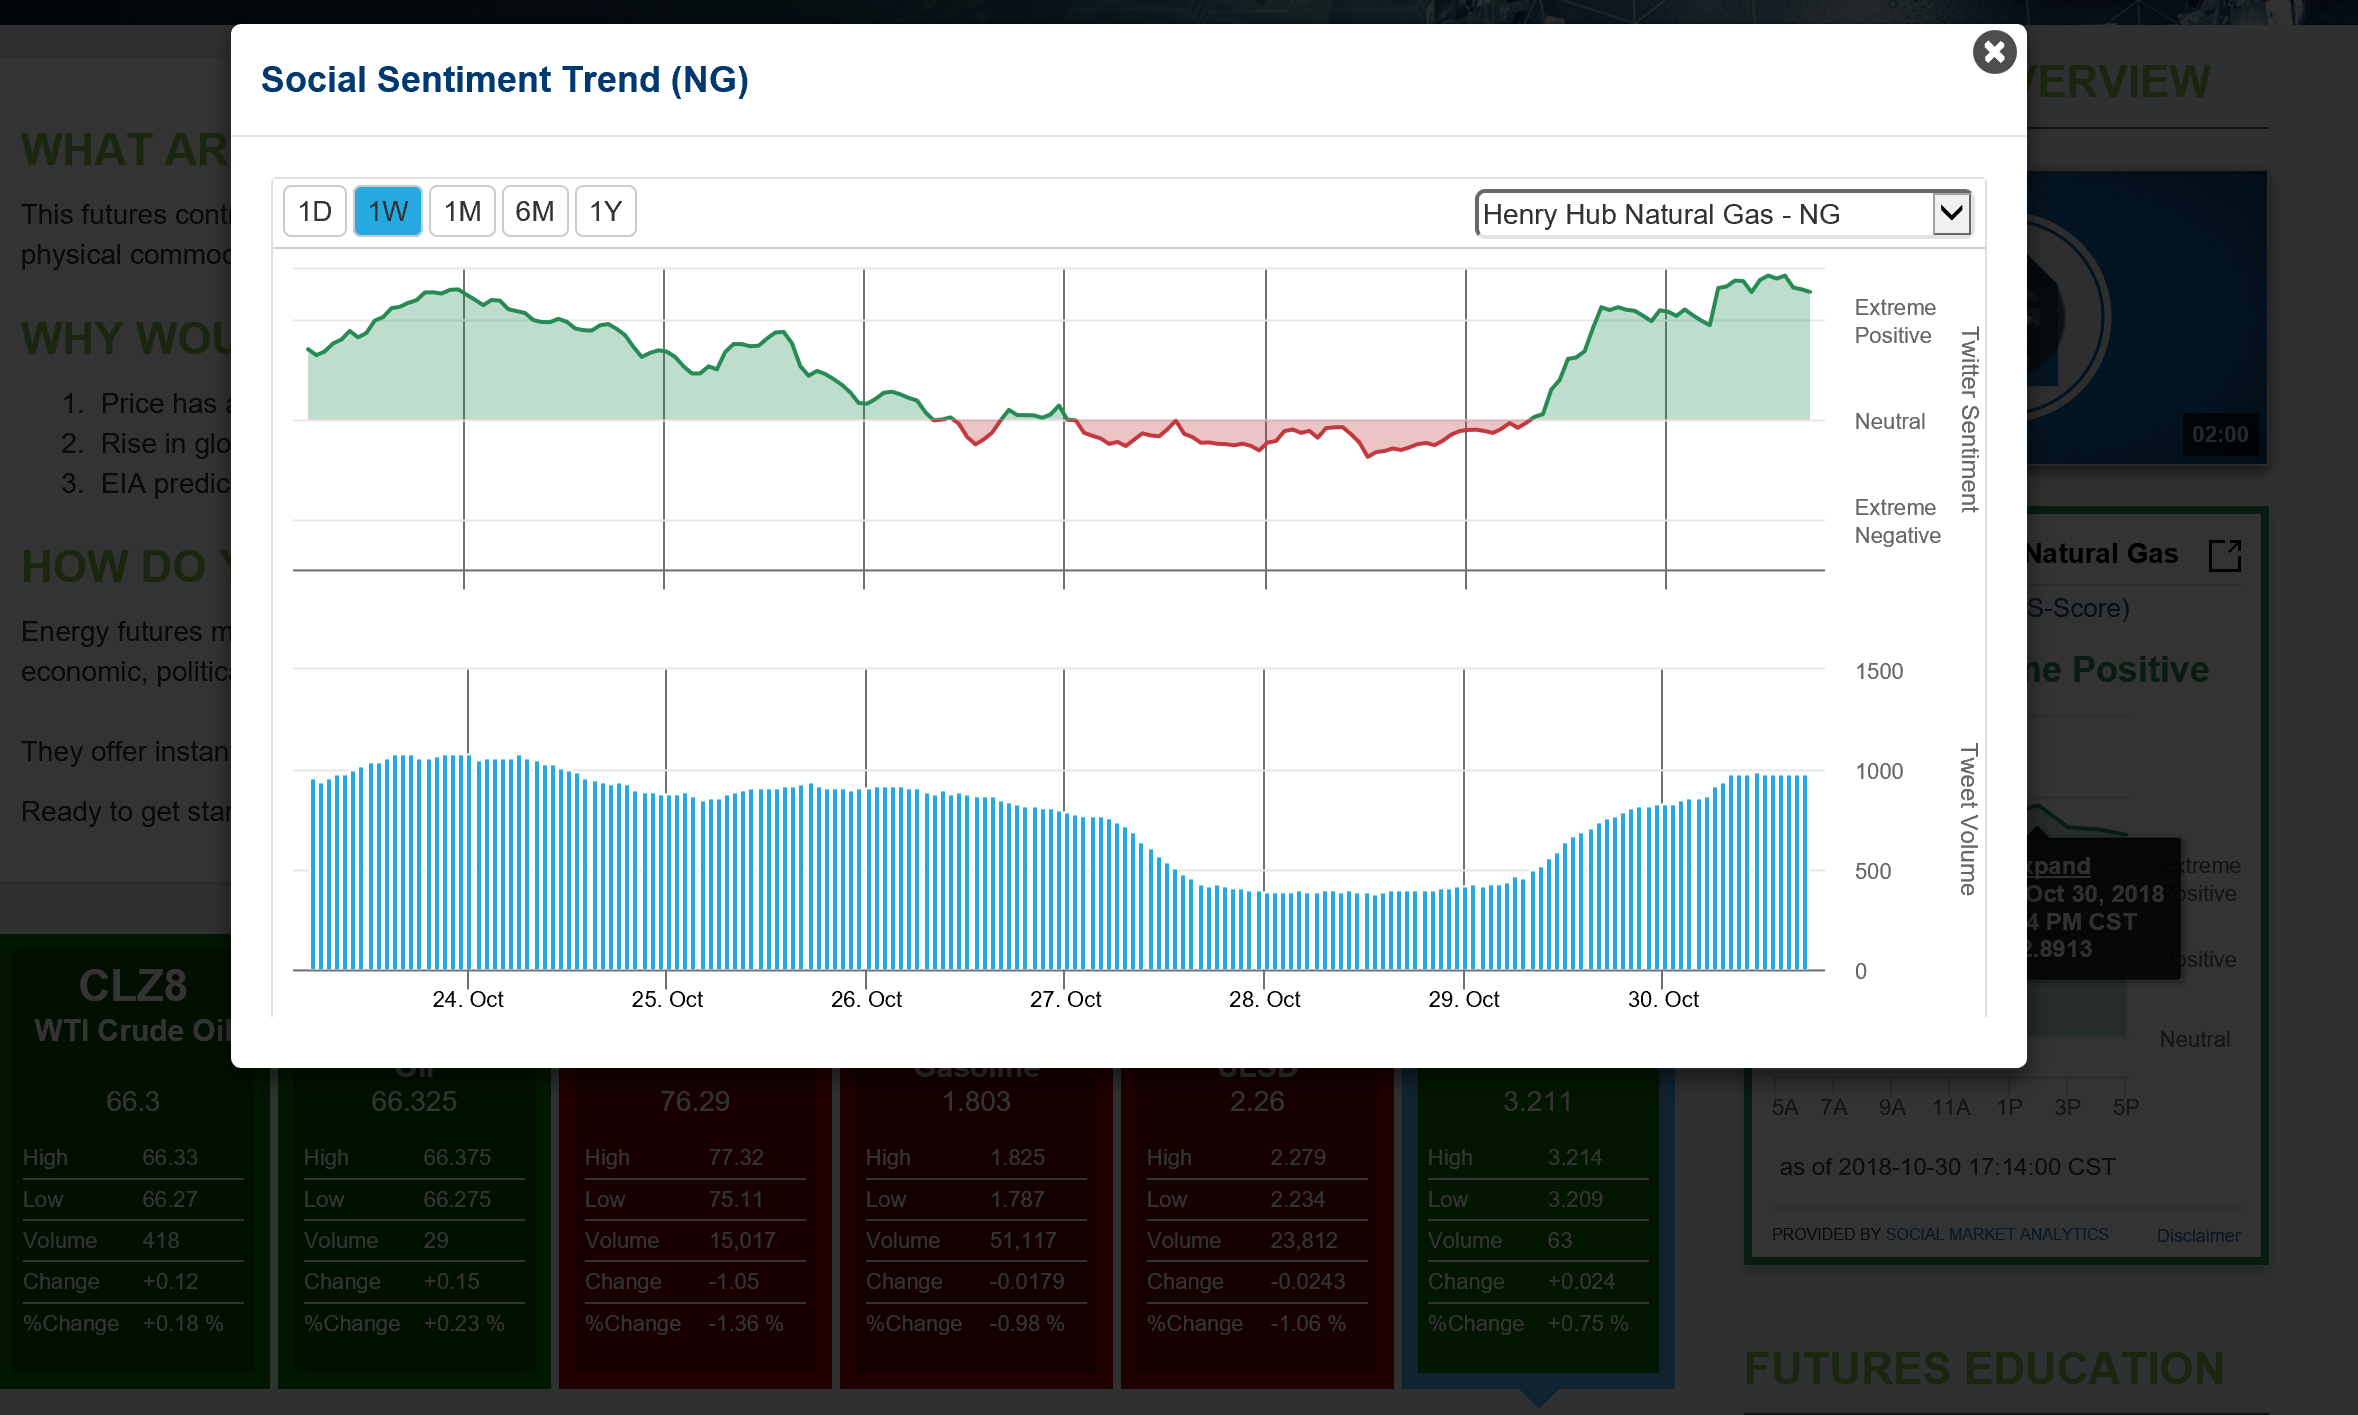
The Sentiment in the Product page has a Pop Out where both Sentiment S-Score and Tweet Volume can be viewed over 1D, 1W, 1M, 6M, and 1Y.
contact: doug@contextanalytics-ai.com www.socialmarketanalytics.com