Social Market Analytics aggregates the intentions of professional investors as expressed on Twitter. We apply our patented filtering and natural language processing(NLP) to Tweets to proactively select Twitter accounts to use in our predictive metrics. We track several metrics to gauge the predictive nature of our dataset. For this blog I am going to illustrate one of these metrics.
2018 was a rough year for the SP500, it lost about 9% (rolling one year). Given market loss and the high volatility we thought it would be an ideal dataset over which to run an experiment. Two questions we get regularly are: How would your data perform in a bear market? And what is the benefit of your NLP and account ratings systems? This blog will answer both questions from the perspective of 2018 market performance.
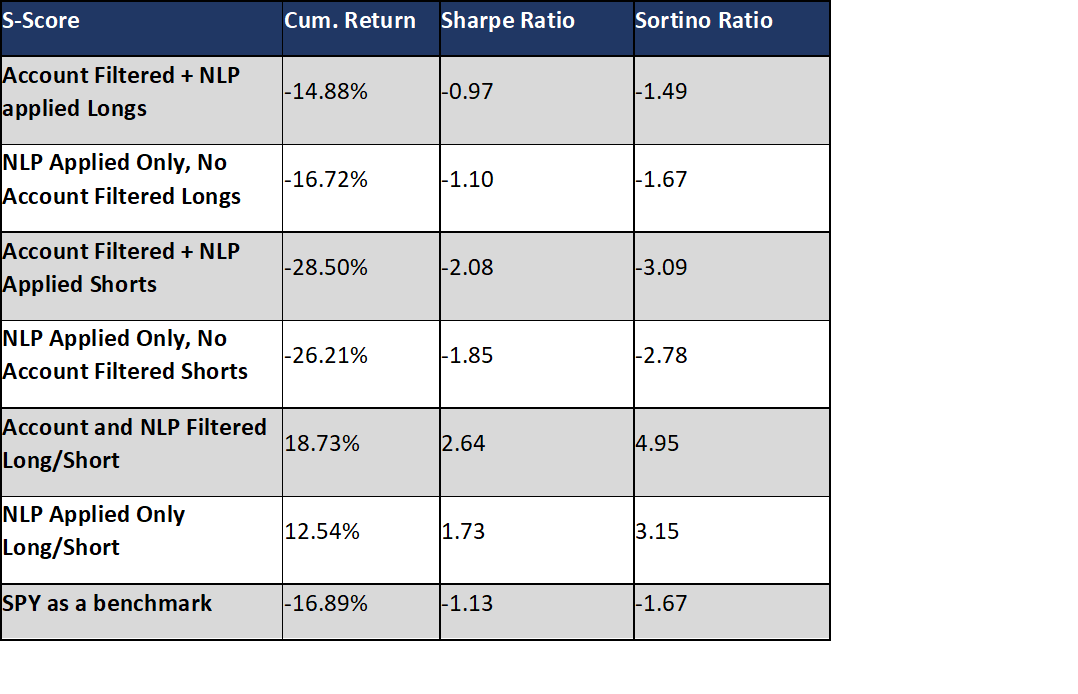
The table below illustrates performance of six theoretical portfolios. These portfolios represent stocks with Social Market Analytics S-Scores of 2 or higher (Long signal) or Social Market Analytics S-Scores of -2 or lower (Short signal). S-Score compares the tone of current Twitter conversations with average tone of Twitter conversations over the last twenty days. Social Market Analytics has multiple baseline for multiple prediction periods.
Each security in our universe represents a proprietary Topic Model. Each Topic is a collection of rules used to include or exclude specific Tweets from security buckets. For example, if you are looking for Tweets about Ethan Allen furniture (ETH) you do not want to include Tweets about Ethereum Crypto Currency (Also symbol ETH) conversations.
We created portfolios with our account filtering algorithms and compared them with portfolios of all twitter accounts discussing our Equity Topic Models. The purpose of the run was to quantify the ability of our patented account filtering algorithms to identify professional, and hence more accurate, investors. Spoiler alert: Our account filtering improved the long/short return by 50% (18.73 for 2018 versus 12.53 NLP only)
NLP applied only:
The NLP only portfolios illustrate the power of our NLP process to accurately identify and fine grain score Tweets discussing securities and companies. Our patented process reads each Tweet multiple times to identify if and how strongly someone is voicing a view of expected future performance. The NLP only portfolios illustrate the predictive power of our NLP in isolation. When you apply the Account filtering you get a predictive boost.
Account Filtered + NLP applied:
Account Filtered plus NLP portfolios illustrate the benefit of applying our account filtering metrics. Early in the life of Social Market Analytics we learned its not just what is being said on Twitter but who is saying it. We developed proprietary metrics to identify investors more likely to be correct about the future direction of a security. When the conversation of these professional investors is significantly more positive than the average conversation over the last 20 days those securities significantly outperform. When the conversation of these professional investors is significantly more positive than the average conversation over the last 20 days those securities significantly underperform.
Portfolio Construction
Portfolios are constructed of securities with an S-Score of 2 or higher (long) or -2 or lower (short). All portfolios are equally weighted. A negative value for a short portfolio denotes a positive return to that portfolio. Short portfolios are supposed to move lower. All securities are entered on the Open based on a 9:10 am Eastern time S-Scores and exited on the Close. There is no overnight exposure.
Result Analysis
We use SP500 as our performance benchmark. SP return is calculated from open to close in the same manner as the selected securities. Using open to close performance the SP500 returned -16.89% for comparison. As you can see from the table the S-Score > 2 outperformed the market and negative S-Score securities significantly underperformed the market (generating positive alpha). The L/S portfolio with NLP only returned +12.54%, NLP plus account filtering improved that performance by 50% to +18.73%. We do not illustrate this as a single factor model but removing 10% a year for slippage and commissions still significantly outperforms.
 Please contact us with any questions or to see how SMA's NLP and filtering capabilities can be used in your investment process. ContactUs@SocialMarketAnalytics.com