This blog post highlights research done on an excellent research platform My Data Outlet. My Data Outlet specializes in integrating financial data into R. They offer an API to access financial data, allowing for a single access point for extracting data. Their tools are excellent for creating backtests and deploying models into production. This analysis was done using the MDO.Factors Library of functions. The mdo.factors library contains samples of publicly available research factors and can be used as a template for creating new factors. They have expertise in the Refinitive QA Direct and MarketQA platforms.
For this research they looked at three SMA factors. As regular blog readers know SMA quantifies the intentions of professional investors as expressed on Twitter and StockTwits. Our S-Score metrics identify when the conversation becomes significantly more positive or negative than normal (conversations on the wings of the standard normal curve). When conversations are at normal levels other factors are driving security price.
For this analysis they used the following SMA S-Factor metrics.
They also divide each of these scores by the security’s price (from Datastream) to create three sentiment yield factors. Yield factors are a new and interesting application of our metrics and should be explored by users of our data.
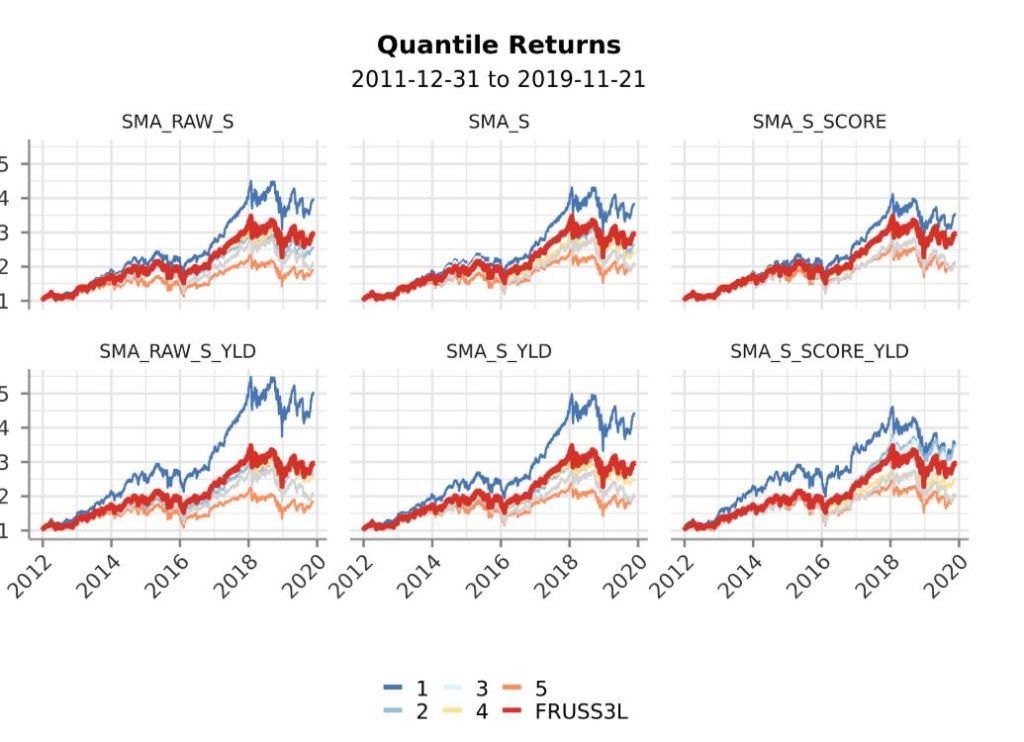
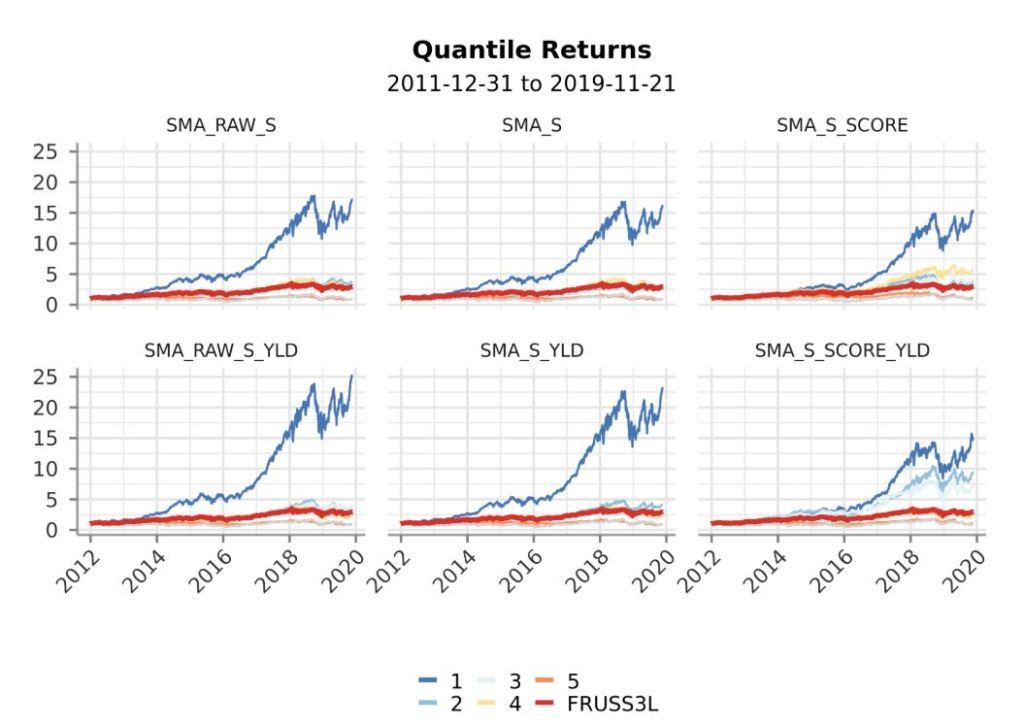
For this test we used daily holding periods – Close to Close. They re-balance every trading day at the close. For this analysis they used a 2:40 pm CST S-Score (20 minutes prior to close) and again, re-balanced close to close. The universe for this test was the Russell 3000 Index. Return charts for quintiles are below. Quantile 1 – highest scored factors and quantile 5 = lowest scored factors.
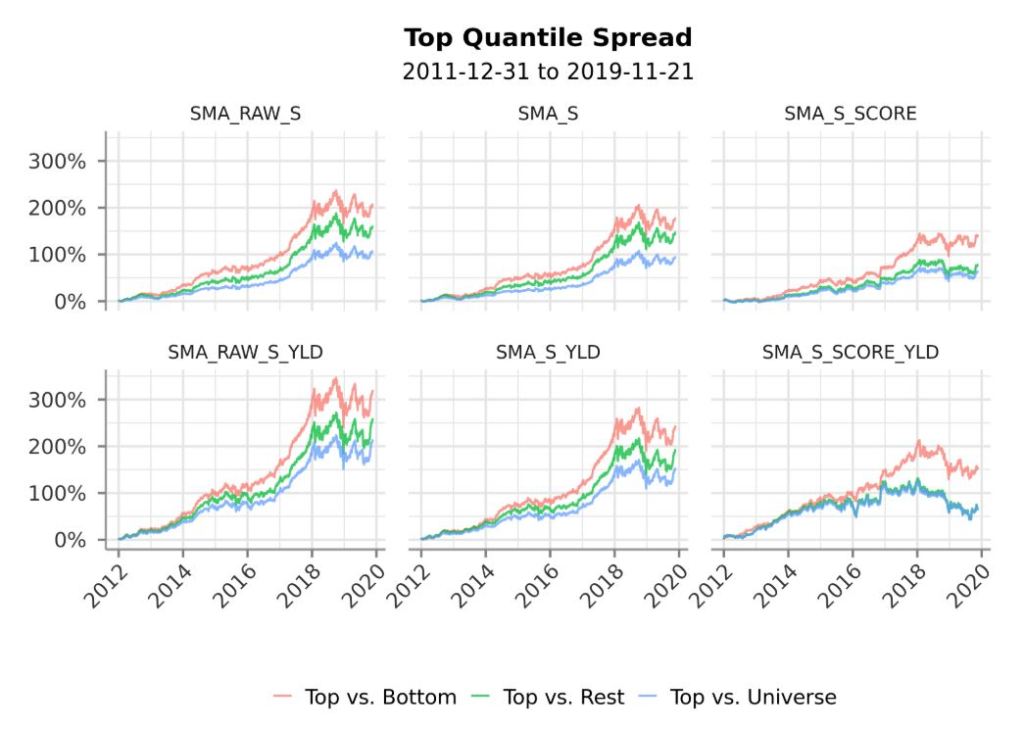
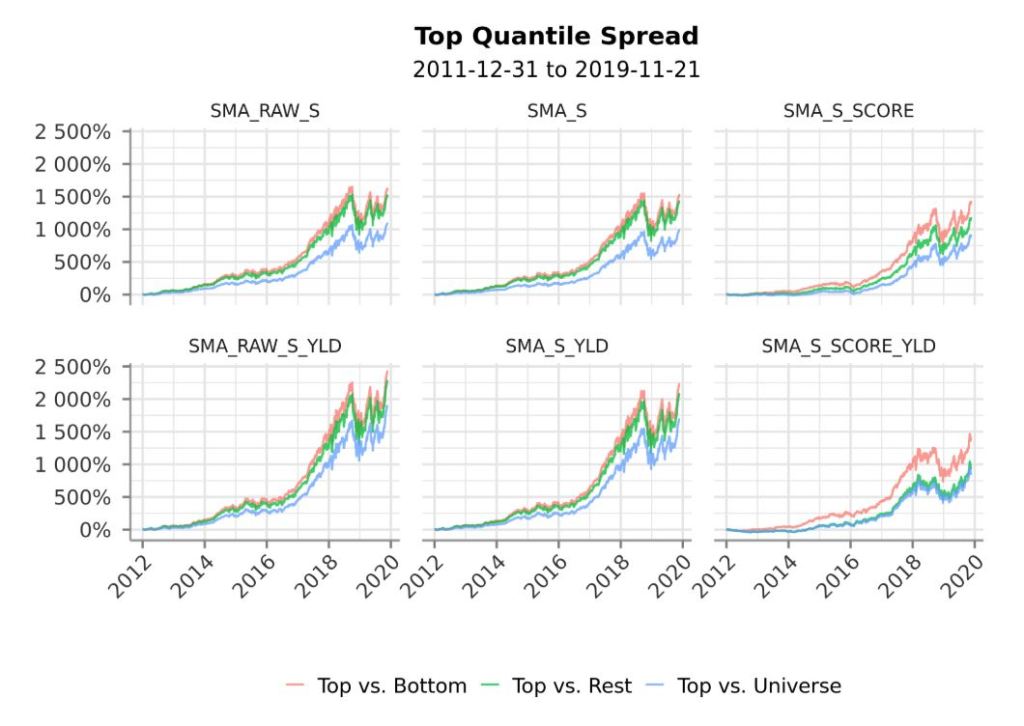
They also looked at the spread of quantiles. Top versus bottom and top versus 2nd,3rd,and 4th quantiles.
A lot of customers ask about sector specific breakouts. Below is an example of how MDO can quickly break out sector level performance. Technology Sector returns are below.
MDO provides a great illustration of the predictive power of Social Market Analytics Sentiment data. For more information ContactUS@SocialMarketAnalytics.com.
Thank you for reading.
Joe