Social Market Analytics (SMA) calculates metrics describing the current conversation on Twitter relative to historical baselines using statistical Z-Score metrics. Most Twitter conversations are neutral on a given day. If the conversation on Twitter is neutral, stock price is being driven by something other than social media. We find that Twitter derived metrics illustrate statistically significant predictive power when the conversation becomes more positive or negative than normal levels. The table below is a good illustration of Z-Score. Points on the curve denote the positive or negative levels of conversation. If the SMA S-Score is greater than 1 the current conversation is more positive or negative than 68% of conversations over the look back period. That is a bullish (S-Score > 1) or bearish (S-score < -1) signal. If the S-Score is > 2 then the current conversation is more positive/negative than 95% of conversations over the look back period. S-Score > 3 moves the percentages out to 99.7 percent.

The below chart has six lines representing S-Scores (Z-Scores) of +2, +1.5, +1, -1, -1.5, -2. All SMA data is out-of-sample, we never recalculate any values. All historical data is pulled from update archives. As the conversation becomes more positive or negative than normal the subsequent security returns become more extreme. S-Scores are sampled at 9:10 Eastern time, 20 minutes prior to market open. We look at subsequent open to close returns bucketed by six S-Score levels. As the chart clearly illustrates the more significant the S-Score the more extreme the subsequent returns. Negative returns of negative S-Scores represent positive alpha.
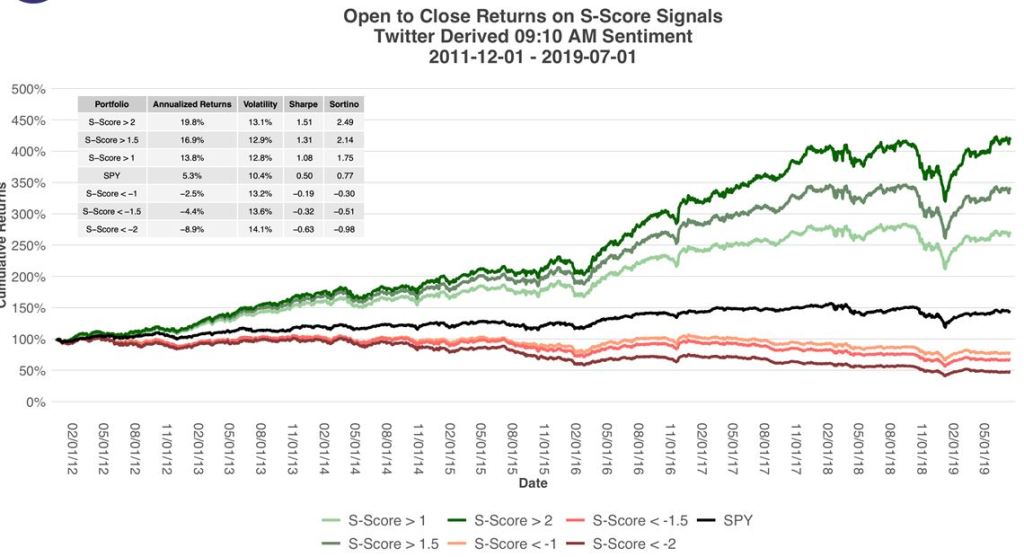
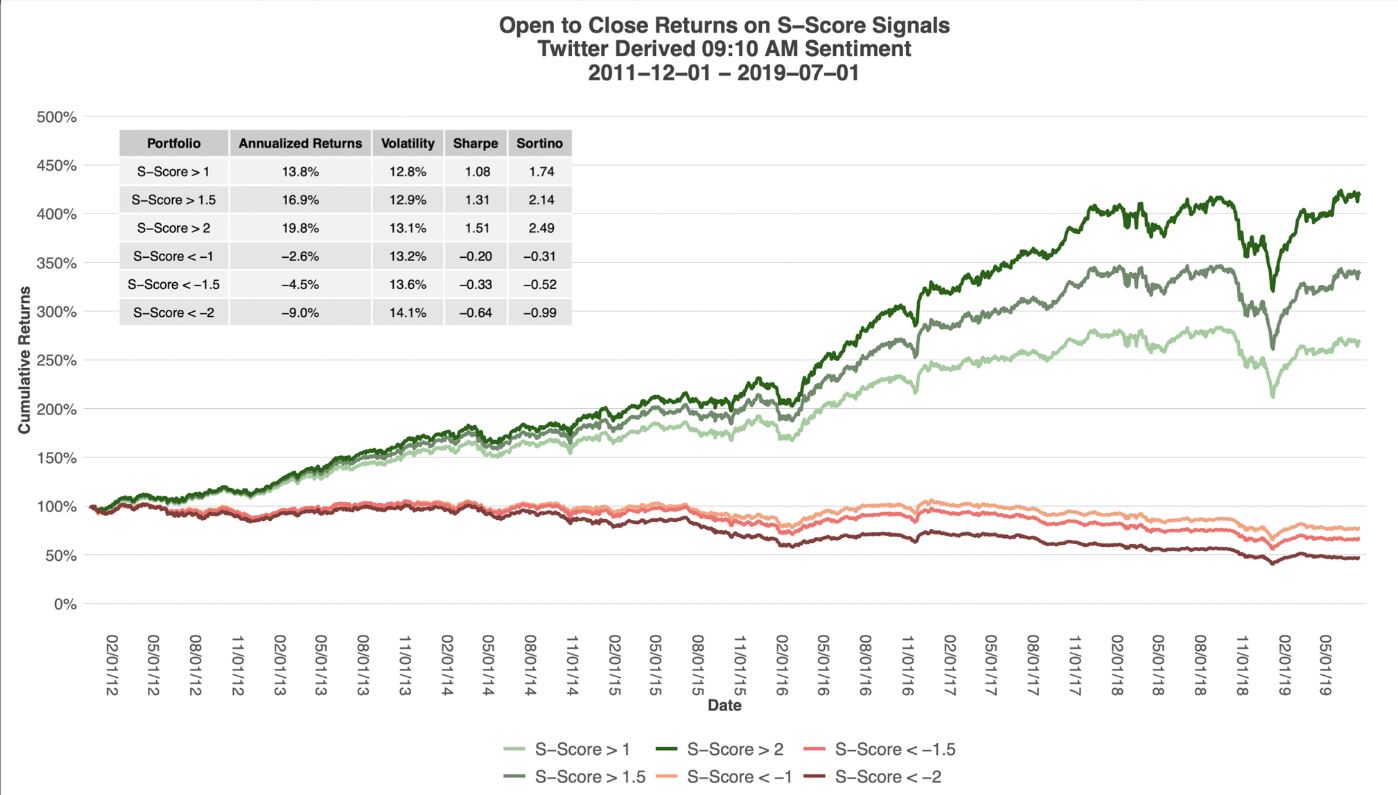
Sharpe an Sortino ratios become more significant as S-Scores become more extreme. SMA publishes 19 different metrics in our S-Score feed. Each metric adds more clarity to the tone of the conversation. SV-Score for example is a metric comparing Twitter volume relative to historical levels for that security. If Twitter volume is higher than normal and the conversation is more positive or negative than normal the signal is stronger.
To learn more about SMA contact us at ContactUs@SocialMarketAnalytics.com