S&P Global and Social Market Analytics today launched Machine Readable Filings (MRF), a sophisticated new data offering which applies Parsing and Natural Language Processing to generate machine readable text extracted from SEC Regulatory Filings. Machine Readable Filings allows businesses and investors to incorporate more qualitative measures of company performance into their investment strategy by using machine readable text from full or individual sections of regulatory filings to enhance their analysis of companies. The parsed textual data allows firms to drill down on both historical and new filings in near real-time.
Machine Readable Filings features the following:
The product feed contains three levels of detail:
As regular readers will attest, my previous blogs have focused on NLP and parsing Twitter and StockTwits based messages. This blog breaks new ground for Social Market Analytics as our first piece featuring Machine Readable Filings. We processed all 10-Ks and 10-Qs mapped to a pricing source (~150,000 documents) and looked at subsequent returns based on two word count based factors.
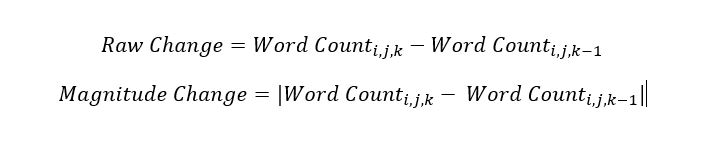
The word count factors we explored were Raw Change and Magnitude Change. Raw Change is the difference between the number of words in a filing and the number of words in the most recent filing of the same type for the same company. Magnitude Change is the absolute value of Raw Change, so it does not account for the direction of change. Below is the formula for the factors created where i represents the company, j represents the filing type (10-K or 10-Q), and k represents the period of the filing.
First, we looked at the Management Discussion & Analysis (MD&A) section because this section has the largest variability across all companies. This section addresses the company’s performance in a qualitative manner. Each value is carried forward from the previous filing until a new filing is released or until the data is 3 months old. The chart below represents a Quintile plot of Magnitude Change of word count in the MD&A section from January 2010 to December 2019.
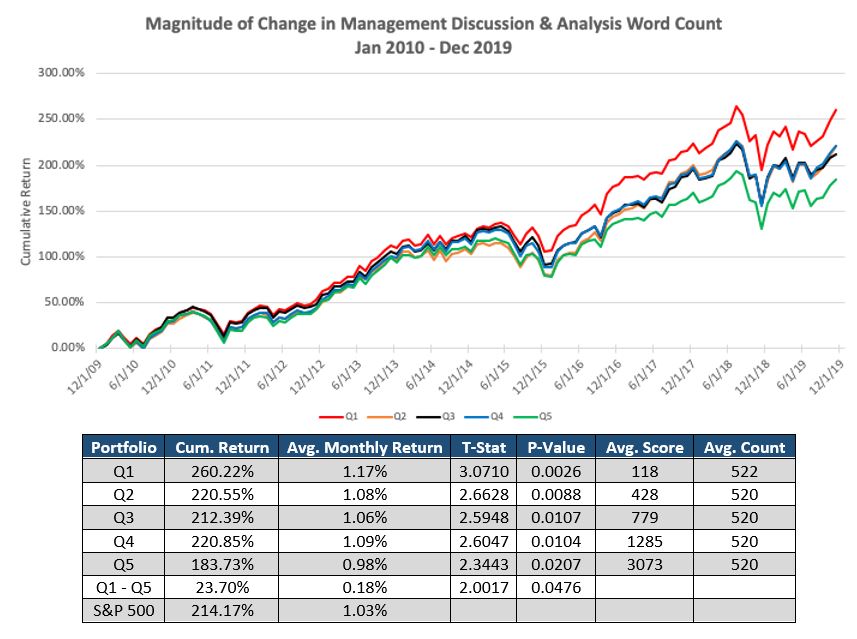
Quintile 1 contains filings with the least amount of change in the MD&A section. Average Magnitude Change of word count in MD&A section for the lowest quintile group is 118 words. Quintile 5 represents the largest Magnitude Change of word count in MD&A section. Average Magnitude Change of word count in this quintile is 3,073 words. This graph shows that in the MD&A section, smaller changes in word count tend to outperform the market and larger changes in word count tend to underperform the market. The hypothetical Long/Short of this variable (Q1 – Q5) is proven significant at a 95% confidence level meaning the average monthly return is greater than 0%.
Next we looked at how changes in word count across an entire document can impact future returns. The largest increases in the number of words in the total document is represented by the green line. The largest decreases in word count is represented by the red line.
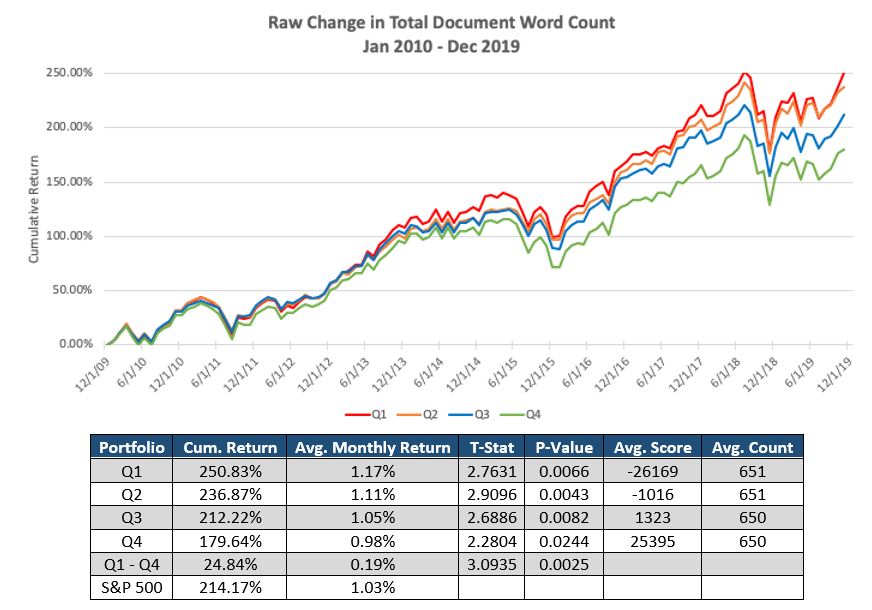
As you can see if there is a large increase in the number of words in the document, the stock subsequently underperforms its peers. On the other hand, if there is a large decrease in word count throughout the document, the stock tends to outperform its peers.
Although this analysis only includes the change in word count of the whole document and the MD&A section, other sections within regulatory filings can provide additional insights into a security’s future return. Furthermore, we expect additional insights to be uncovered using natural language processing to quantify the sentiment of the underlying text at the various levels of the document. These analyses and more will be explored by Social Market Analytics and S&P Global in the future.
S&P and SMA are excited about the launch of this new product. This is the first product to break out documents into component parts and provide a full historical analysis. To learn more about or schedule a trial please ContactUs@SocialMarketAnalytics.com.