In April 2020, S&P Global Market Intelligence and Social Market Analytics, Inc. (SMA) launched ‘Machine Readable Filings’ (MRF), a sophisticated textual data offering which applies Parsing and Natural Language Processing to generate machine readable text extracted from SEC Regulatory Filings. Machine Readable Filings allows businesses and investors to incorporate more qualitative measures of company performance into their investment strategy by using machine readable text from full or individual sections of regulatory filings to enhance their analysis of companies. The parsed textual data allows firms to drill down on both historical and new filings in near real-time. My last blog introduced the product and illustrated some basic return characteristics present in filings word count.
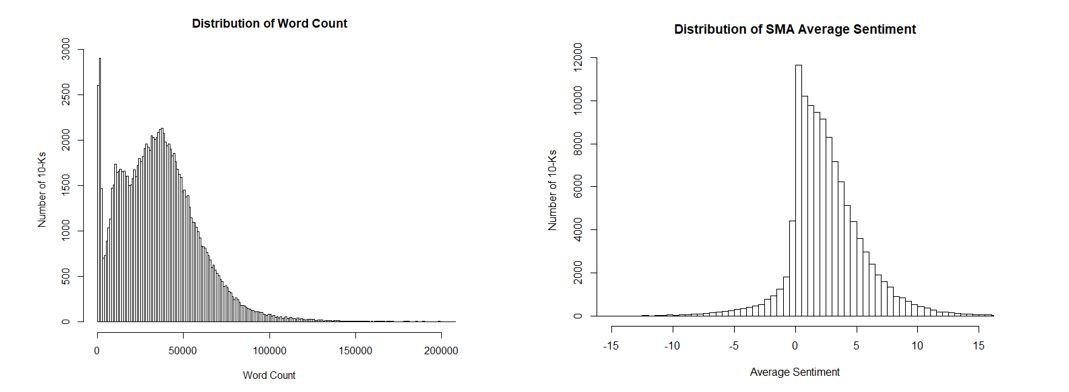
This blog explores the predictive nature of filings using SMA patented NLP and machine learning. For our analysis we used all active securities with a price greater than 5 dollars. Our analysis starts in 2006. Securities are broken into quintiles based on each factor. These factors are samples of the extensive metrics that can be created with this data. Quintiles are re-balanced monthly based on each company’s most recent filing. 10-Q’s are compared to prior 10-Q’s and 10-Ks are compare to prior 10-K’s. These are not meant to be trading models. They illustrate the predictive power of the data and use as broad a universe as possible. Two interesting distributions are below: distribution of word counts for 10-K (mean 36,000) and distribution of average sentiment. As you can see companies try and keep the 10-K as upbeat as possible.
Our first factor is Change in Sentiment Hits. Sentiment hits are the number of times our NLP was able to identify a word or segment in a sentence. Positive hits + Negative hits + Neutral hits. The green line represents filings with the largest increase in sentiment hits while the red line represents filings with the largest decrease in sentiment hits. Large increases in sentiment hits tend to under perform and large decreases in sentiment hits tend to outperform its peers.
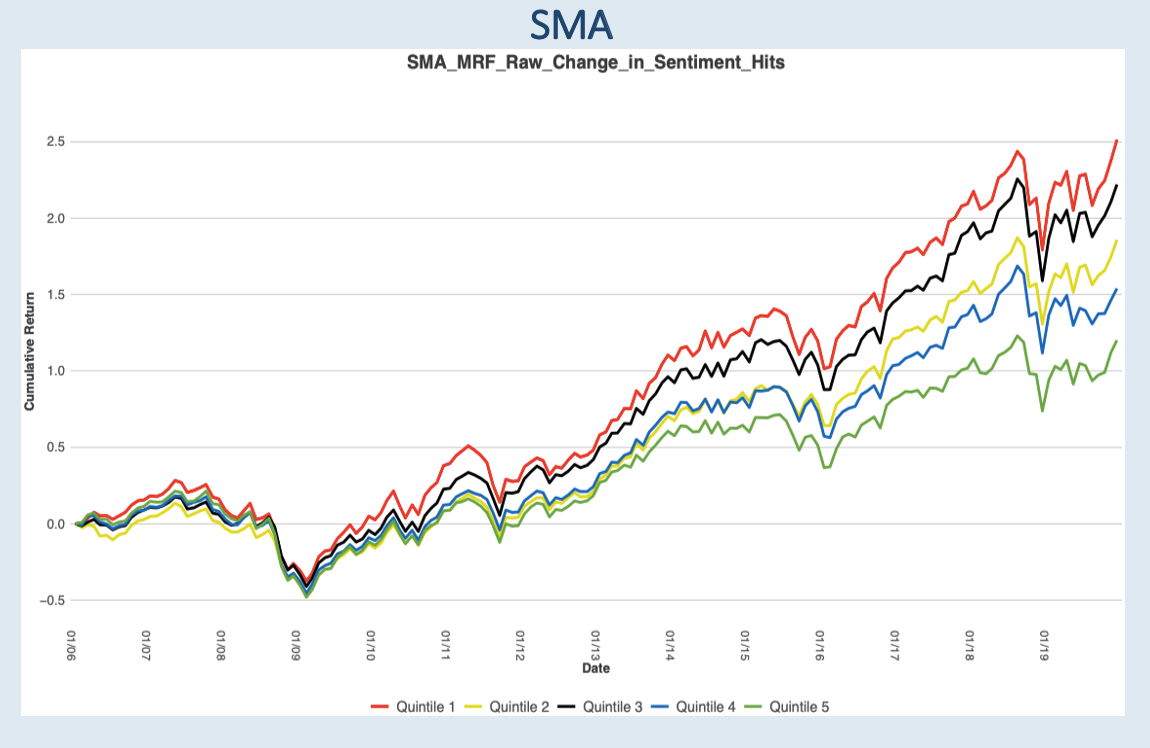
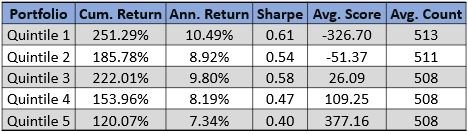
The quintile performance characteristics are below. Although quintile 2 and 3 are out of order you see the average values for those quintiles are near zero. Quintile 1 outperforms quintile 5 by 3% annualized.
The next factor we are analyze is what percentage of the document does the parser hit. Many filings are filled with general information not necessarily providing meaningful statements. The green line represents filings with the highest percentage of sentiment hits in the document while the red line represents filings with the lowest percentage of sentiment hits in the document. A higher percentage of sentiment hits tend to outperform and a lower percentage of sentiment hits tend to under perform its peers. Companies with documents containing more meaningful content outperform companies with documents with less meaningful content by about 3.5% annualized.
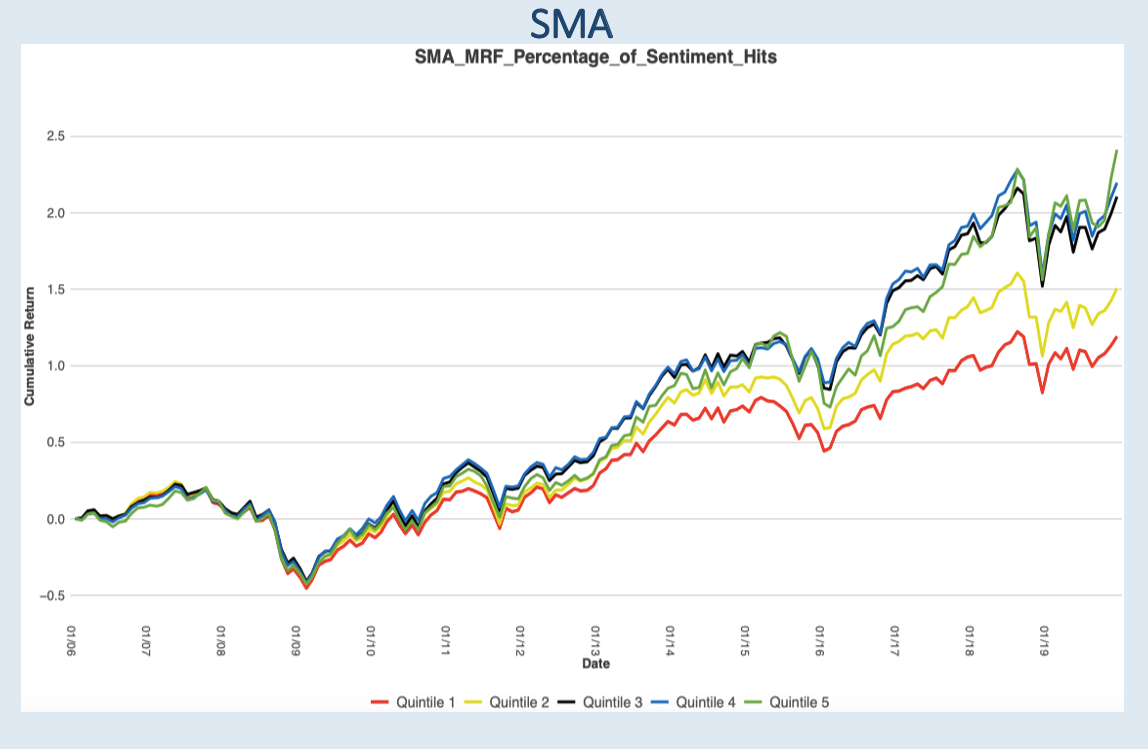
Quintile 5 – Quintile 1 annualized is 3.5%
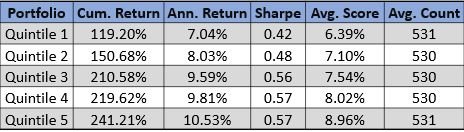
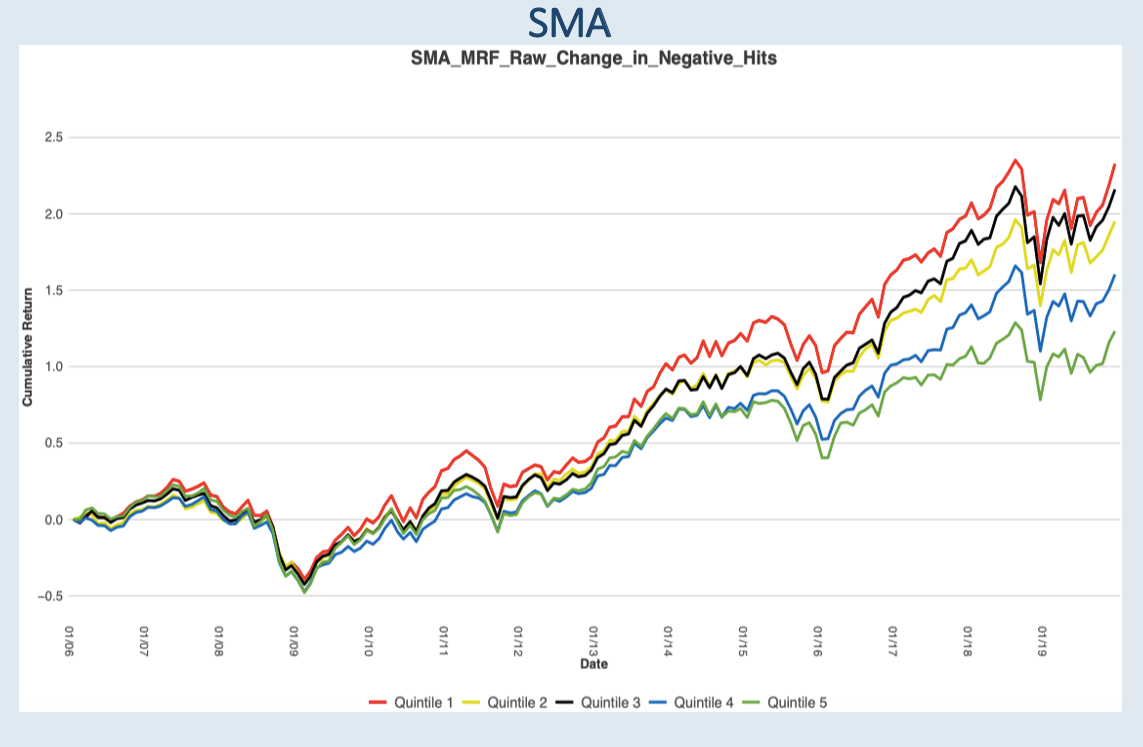
The third factor we are exploring is changes in negative hits. Companies with increasing negative hits are discussing more negative information than prior quarters, they subsequently under perform. The green line represents filings with the largest increase in negative hits while the red line represents filings with the largest decrease in negative hits. A large increase in negative hits tend to under perform and a large decrease in negative hits tend to outperform its peers.
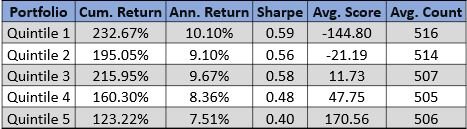
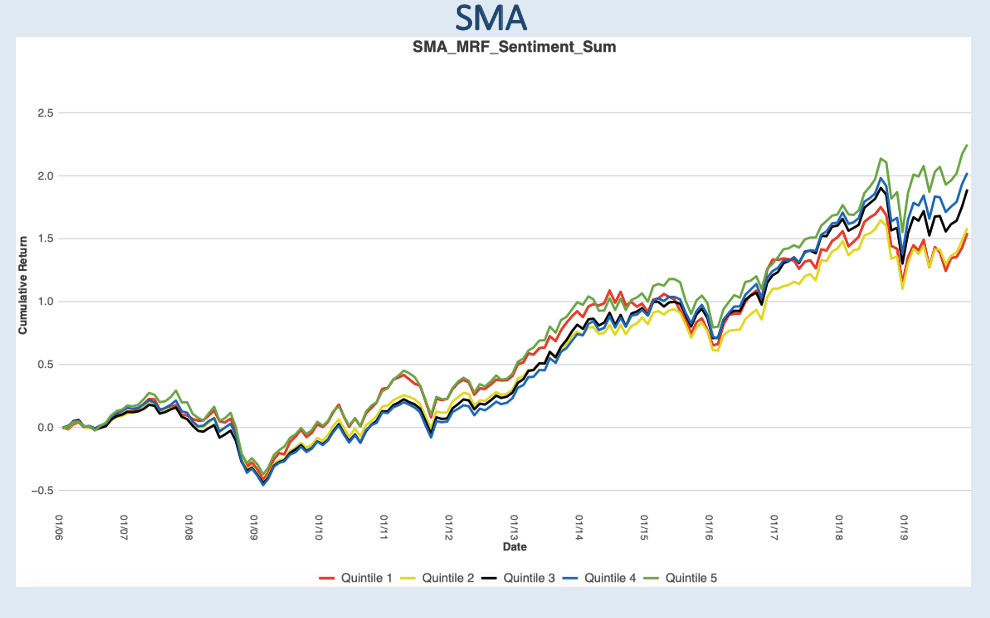
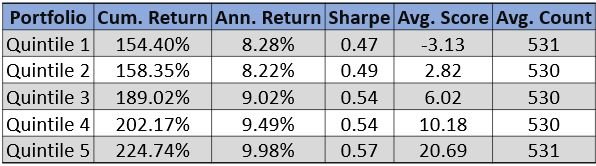
The last factor we explore is cumulative document sentiment. Quintiles are based on summations of all sentiment hits in the document. More common analysis of sentiment is by section. We identify parts sections and subsections in this product providing a myriad of ways to analyze the data. At the most aggregated level sentiment is predictive. Document length has a large impact on overall sentiment. Z-Scores of this factor are a good way to compare prior documents. As you can see in the chart companies with more positive total document sentiment tend to outperform companies with more negative total sentiment.
Quintile 5 outperforms quintile 1 by 1.7 percent annualized.
There are many ways to analyze the MRF data set. Filings are parsed by Item, Section, and sub-Sections to 2006 for historical back testing. This analysis looked at only 10-K’s and Q’s ‘Machine Readable Filings’ (MRF) cover 20 types of SEC filings. This blog covers a small portion of the research. The U.S. SEC Edgar Data is live on the S&P Xpressfeed. International Reports will be released later in 2020. To learn more or to start a trial please ContactUS@SocialMarketAnalyitcs.com.