In the wake of the recent GameStop (GME) short squeeze, we received a lot of inbound questions on social media’s predictive power for short squeezes. Social Market Analytics (SMA) classifies different types of conversations on Twitter with one topic being Short Squeezes. Looking at subsequent returns of stocks with short squeeze conversations leads to different return characteristics based on when the conversation occurred. This blog will explore subsequent Open-to-Close return characteristics when the short squeeze conversation occurs prior to market open and the subsequent Close-to-Open returns and when the short squeeze conversation occurs prior to the market close.
We generate our social media metrics on 4,000+ US Equities every minute 24/7. Our historical data is out-of-sample since 12/1/2011 making it suitable for quantitative back-testing. In this blog we used all equities in the SMA universe. Morning signals are generated at 9:10am US/Eastern, afternoon signals are at 3:40pm US/Eastern.
Tweets discussing short squeezes are identified and classified by our Natural Language Processing and Topic Modeling technology. The number of Tweets discussing a short squeeze in relation to a specific security are aggregated and ranked. In this analysis we are looking at the 'squeeze-count' metrics in our data feed, which is the Tweet volume that contains any ‘short squeeze’ keywords about a certain security. The Top 50 securities with the highest ‘squeeze-count’ are equally weighted in the ‘Top_Squeezes’ portfolio. If there is a tie on the 50th security, all securities tied are included in the portfolio. Therefore, portfolio counts could be greater than 50.
The first graph illustrates the subsequent Open-to-Close performance of securities with the most short squeeze terms prior to market open. The blue line represents the cumulative Open-to-Close performance of the top 50 stocks with the highest ‘squeeze-count’. For comparison, the black line represents the S&P 500. These securities in the portfolio significantly underperform intraday. It appears that conversations prior to market open are more about people wanting a squeeze versus it happening. The GME squeeze is marked in the graph.
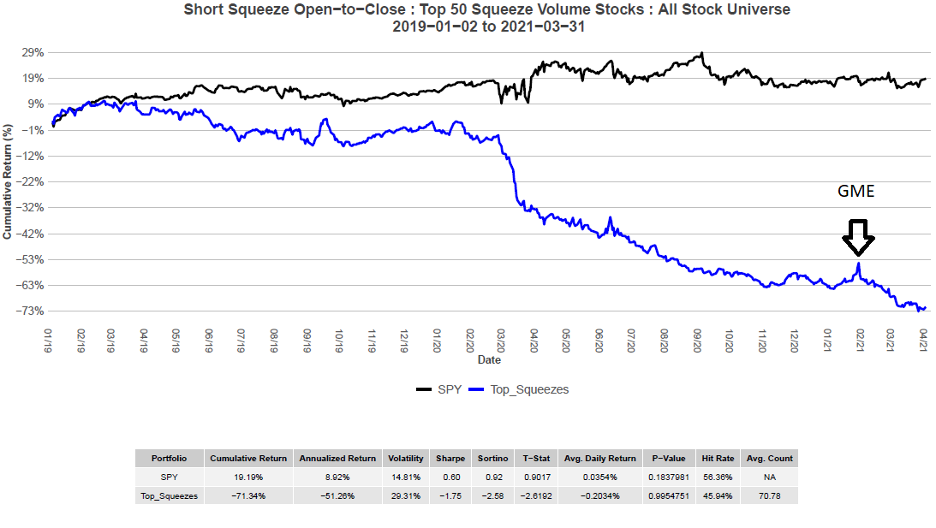
Cumulative performance is -71.34% with a -2.62 T-Stat and a p-value of 0.0045. These returns are significant at the 1% level. One caveat to the performance is there is no accounting for hard-to-borrow securities.
The next chart is more interesting. Short conversations occur during the day and are aggregated at 3:40pm US/Eastern. The average subsequent Close-to-Open returns of the top 50 stocks with the highest ‘squeeze-count’ are shown by the blue. As you can see from this chart, stocks with intraday short squeeze conversations move significantly higher overnight.
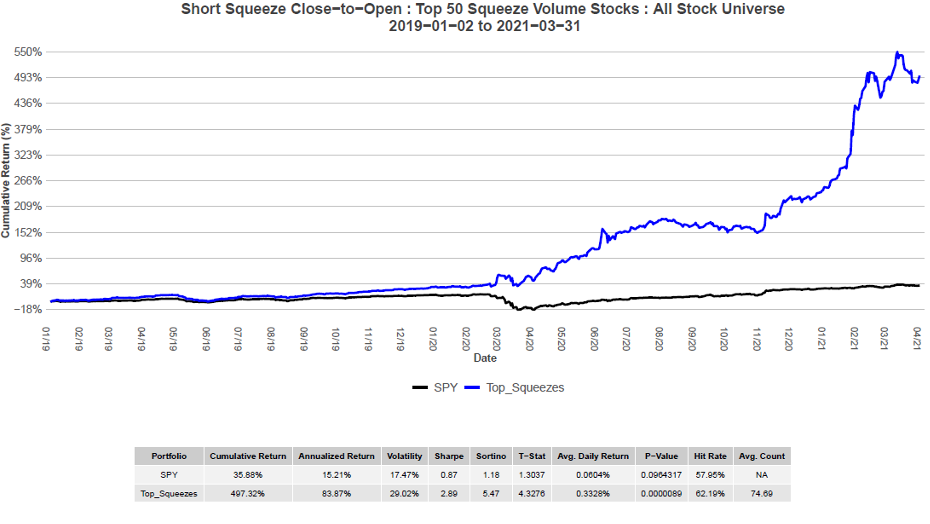
Cumulative return for this theoretical portfolio is 497% with a 2.89 Sharpe, 5.47 Sortino, 4.33 T-Stat, and an infinitesimally small P-Value. This proves the significance of this portfolio at the 1% level.
SMA Short Squeeze Data Feed is available through a RESTful JSON and XML API or as FTP files. The data can be packaged at different timestamps throughout the day.
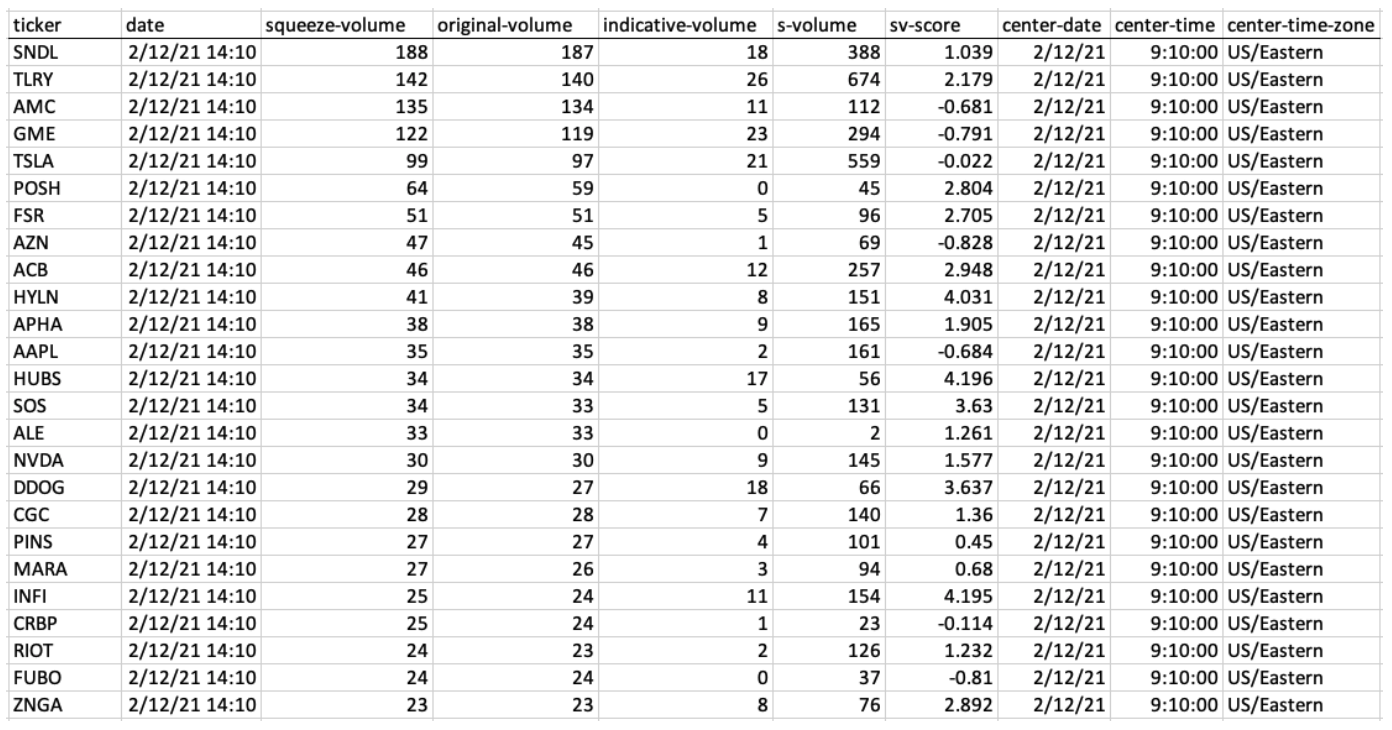
Data Sample:
At SMA we aggregate these short squeeze conversations twice a day and make them available to customers. To access this data or many other SMA services, please ContactUS@SocialMarketAnalytics.com