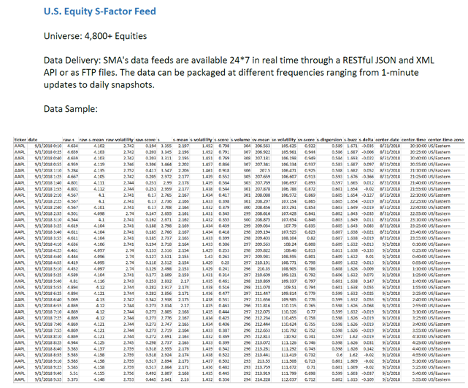
Social Market Analytics, Inc. (SMA) has been warehousing and normalizing social media signals, called S-Factors, since December 2011. SMA has collected nearly 10 years of out-of-sample data, which allows back tests of longer holding periods. SMA’s typical S-Factors are a daily view on social sentiment and is great at predicting subsequent price movement in securities 1-3 days out. By aggregating S-Factors over longer time horizons, testers / quantitative models can generate social sentiment signals that are more suitable for trading over weekly, monthly, or even quarterly holding periods.
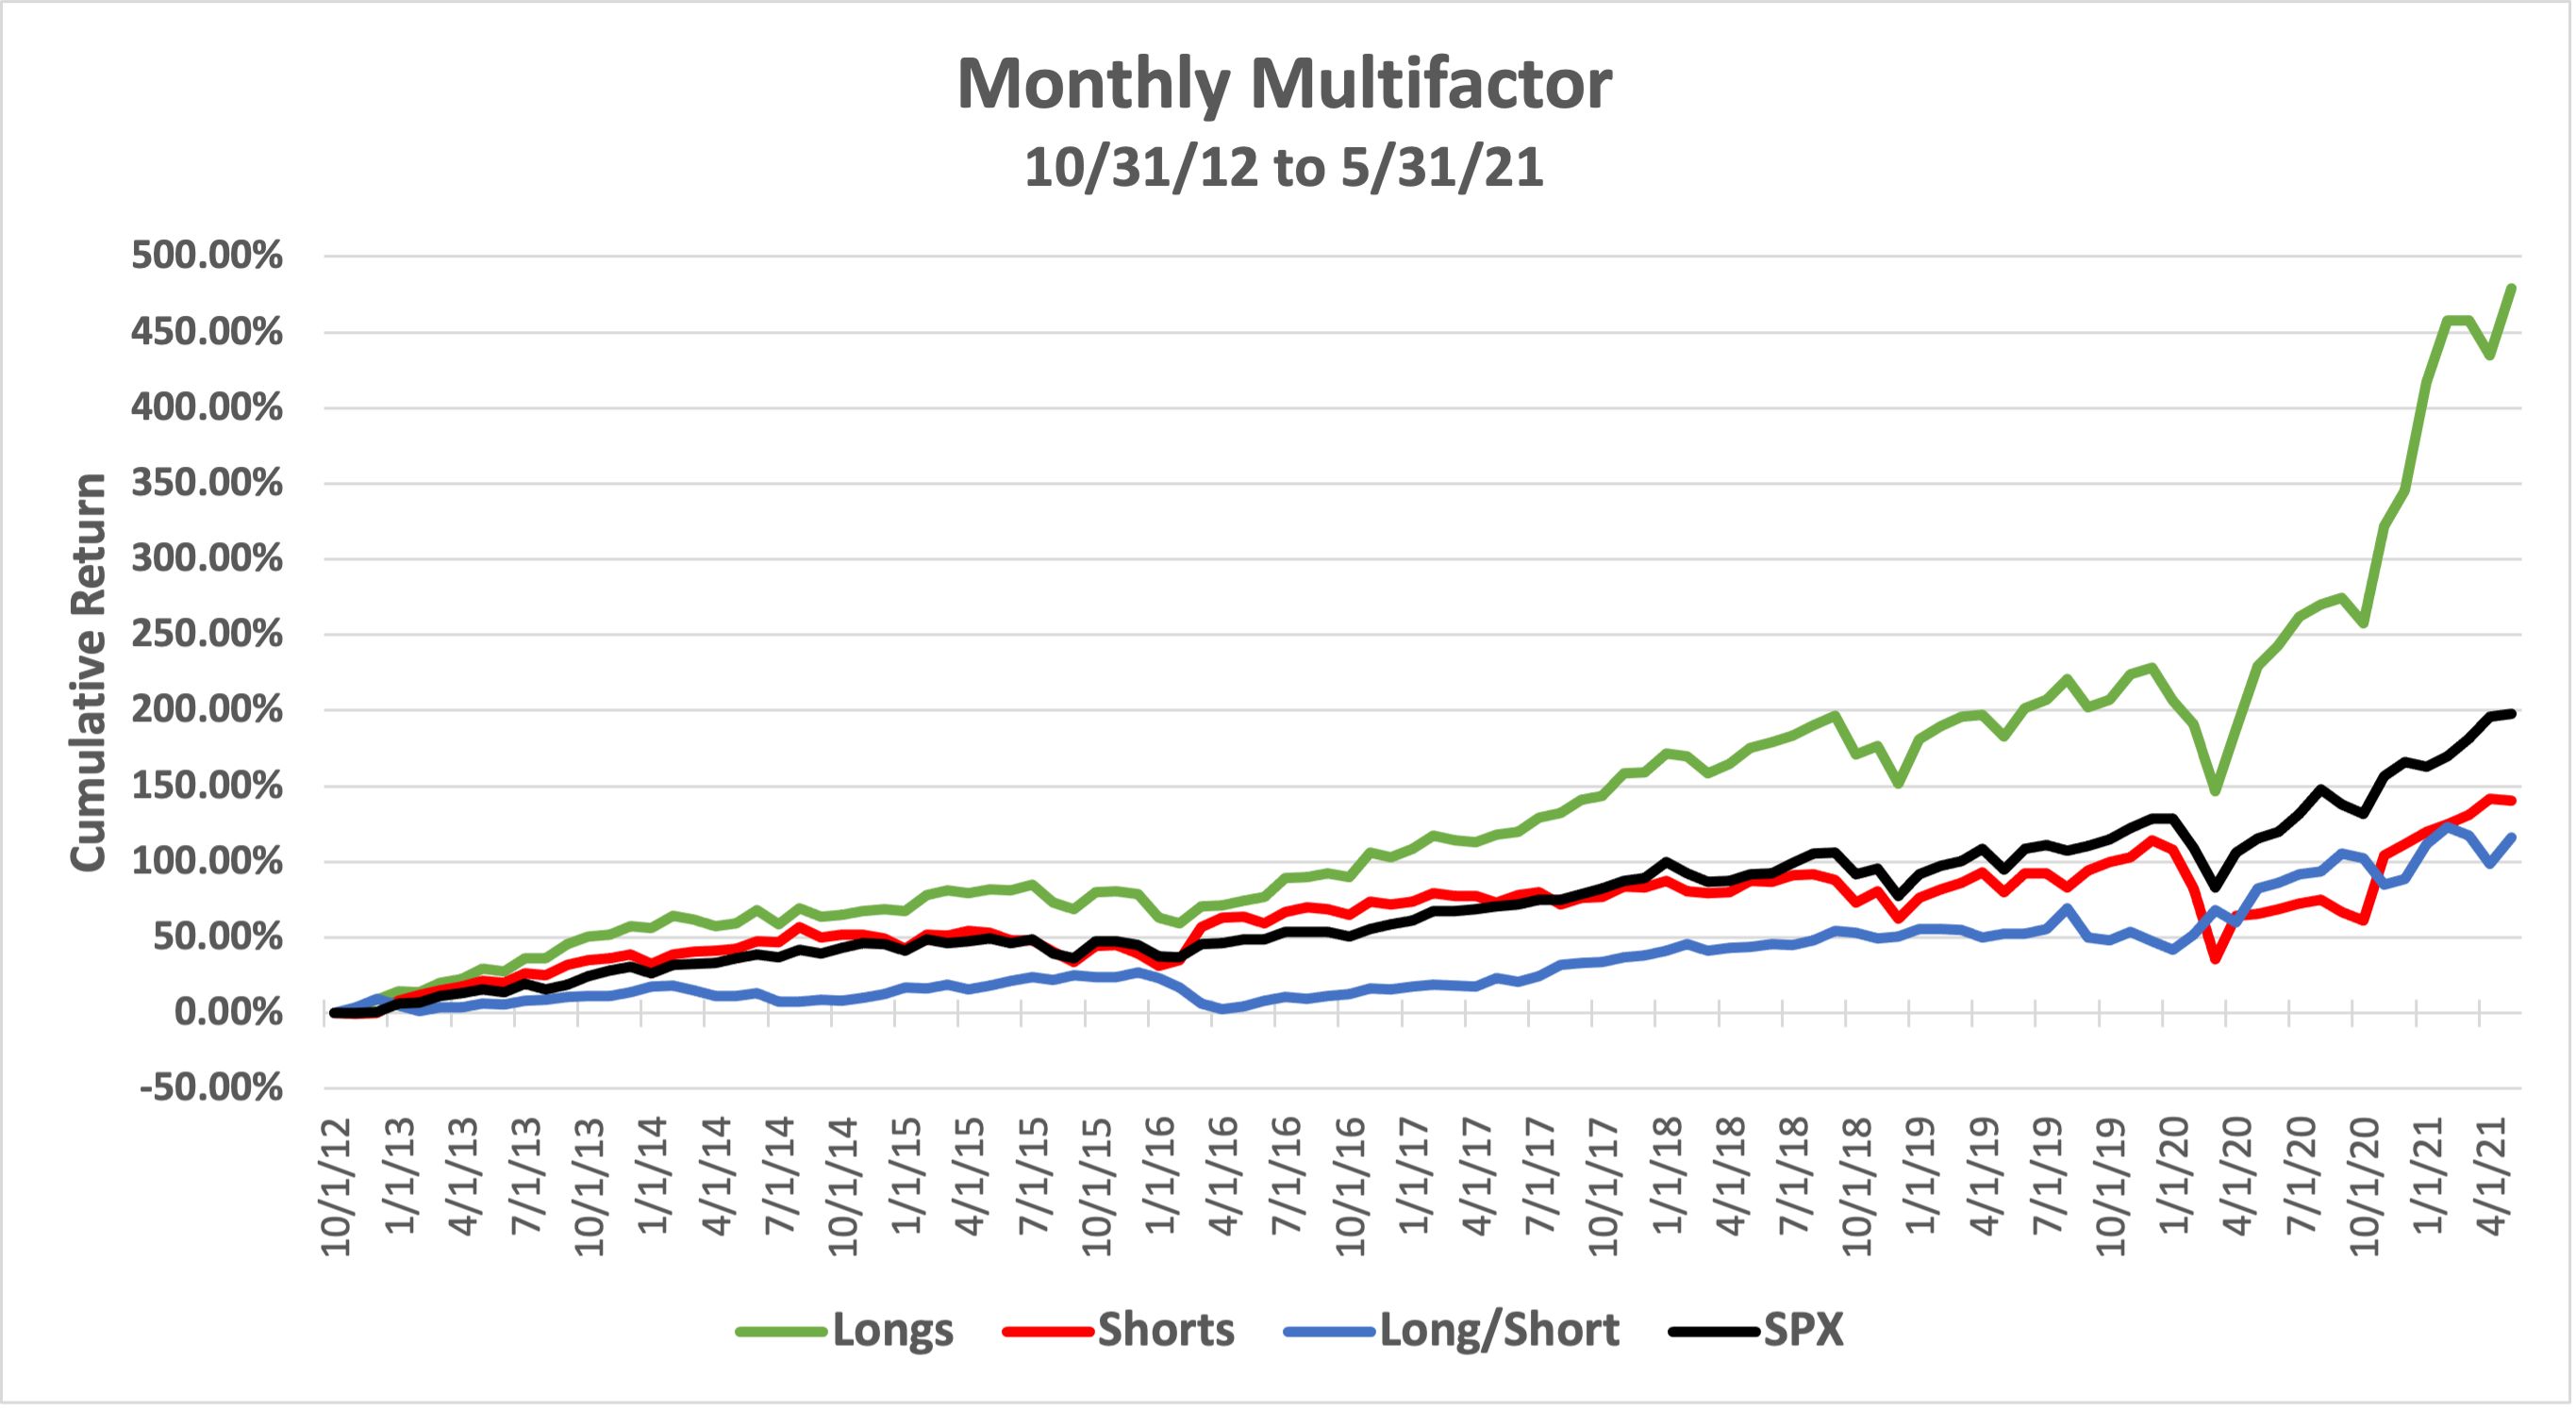
This blog tests our hypothesis that heavily talked about securities with positive sentiment over the past month will outperform the market. We also expect heavily talked about securities with negative sentiment over the past month will underperform the market.
The strategy below is called the ‘Monthly Multifactor Strategy’ because the signal comprises of 3 S-Factors: Raw-S, S-Volume, and S-Buzz. These 3 factors are a view of sentiment and tweet volume over the previous 24-hour period. By taking these factors once a day, you can aggregate the data over any time horizon to create long-term factors at your desired length. Below are the Long-Term factors created for this strategy:
![]()
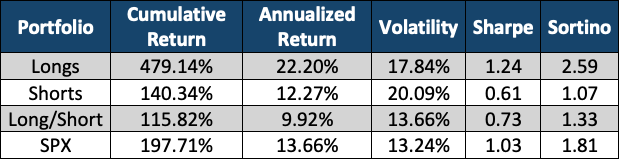
This is a Monthly Long Only or Long/Short strategy.Trades are entered on the Market on Close price of the last market day of each month. Securities are selected 20 market days prior to trade execution. The Top 50 stocks with the highest Multifactor Score are Longs and the bottom 50 stocks with the lowest Multifactor Score are Shorts.
Stocks are weighted within each portfolio based on the rank of the Multifactor Score. Stronger scores have a higher rank numeric value (ranges from 50 to 1).
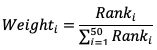
The combination of the two portfolios is the Long/Short. The Long and Short baskets have an equal dollar amount invested.
About Social Market Analytics:
SMA is a leader in unstructured financial data from Social Media to Machine Readable Filings (MRF). SMA is a preferred Twitter Finance partner and Stocktwits vendor. SMA partners with S&P Global Market Intelligence on Machine Readable Filings (MRF) across U.S. Edgar Filings and Global Annual Reports.
Founded in 2011, Social Market Analytics, Inc. goal is to harness the massive amount of unstructured financial data across both Alternative and Traditions sources into machine readable textual data feeds for Quantitative and Quantamental analysis. SMA’s DNA goes back to its predecessor firm Quantitative Analytics,
Inc. (QA Direct) which was acquired by Thomson Reuters (Refinitiv).
SMA’s Patented processes are unique in the emerging field of Machine Learning, Financial Sentiment Natural Language Processing Textual Parsing, and Source Accuracy.
Contact:Doug Hopkins at doug@contextanalytics-ai.com