In this analysis we are testing whether SMA’s S-Factor data is accurate predicting price movements in equities during earnings season. The dataset we look at includes all US Equities in SMA’s universe, covering over 4,500 equites, that released earnings between 1/13/2020 and 8/16/2021.
We first looked at Open-to-Close returns after earnings have been released. For instance, if earnings were released after-market-close yesterday or before-market-open today, we look at SMA’s S-Score at 9:10 am ET and execute a hypothetical Open-to-Close trade. If S-Score > 2, then that security is placed in the Long bucket. If S-Score < -2, then that security is placed in the Short bucket. All other S-Scores are marked as Neutral.
In a universe of stocks with Price > $5 there are a total of 20,038 instances in the dataset with 3,575 unique tickers. Below are two tables with the average return and the count within each bucket.
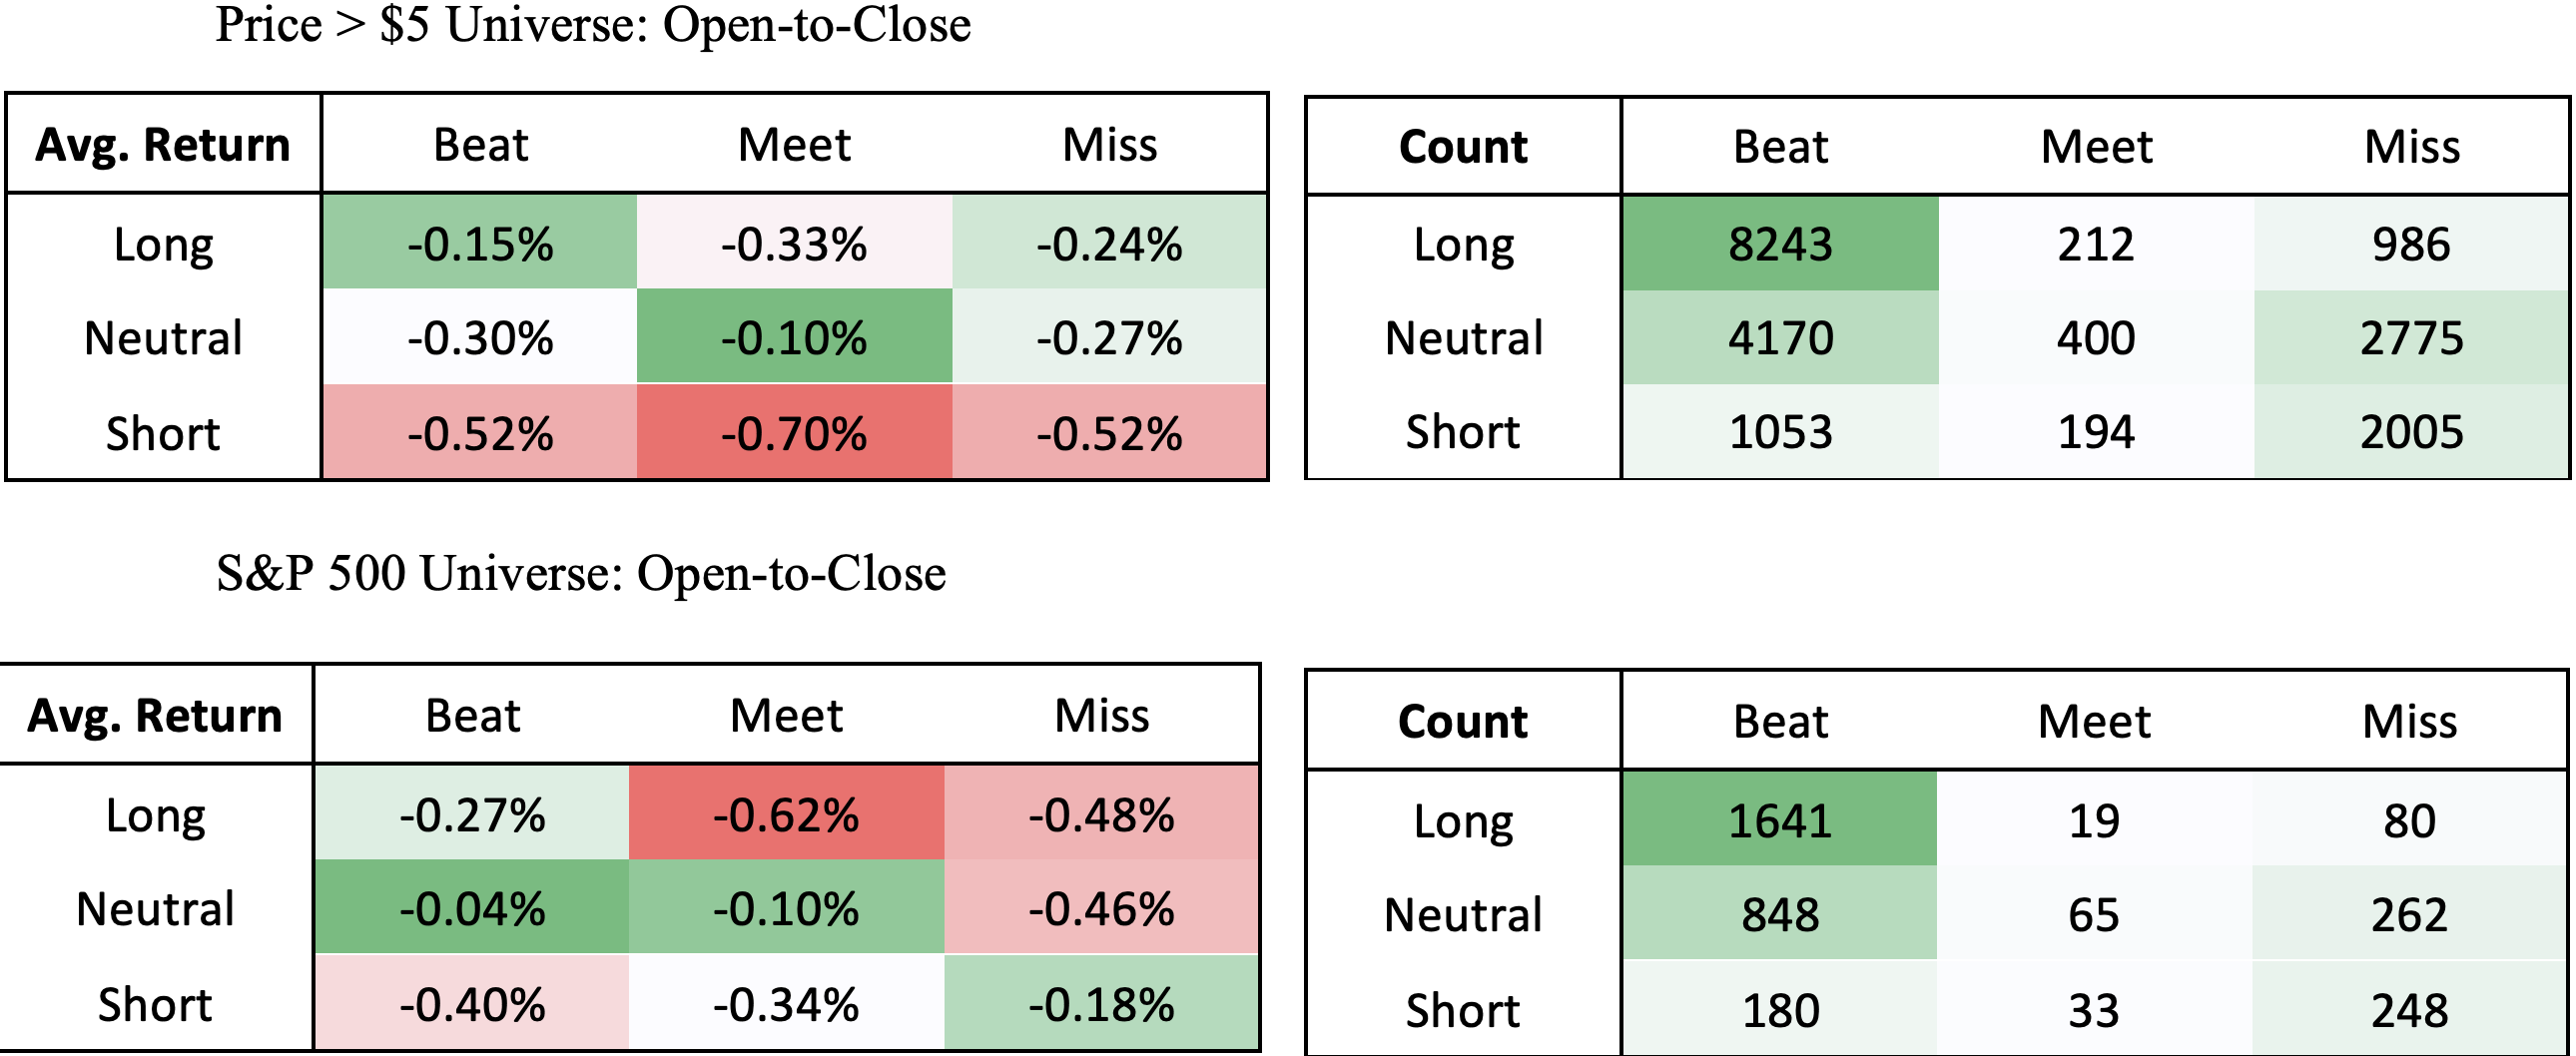
From the tables above, the average Open-to-Close return of an equity after their earnings release has been negative. Large Cap stocks price movements are more difficult to predict on earnings dates compared to small/mid cap stocks. When comparing the S-Scores in the Price > $5 universe table, regardless of the earnings results, the Longs outperform the Shorts significantly.
Because this is example is executing on the open, much of the alpha gained on the earnings release has already been priced in overnight.
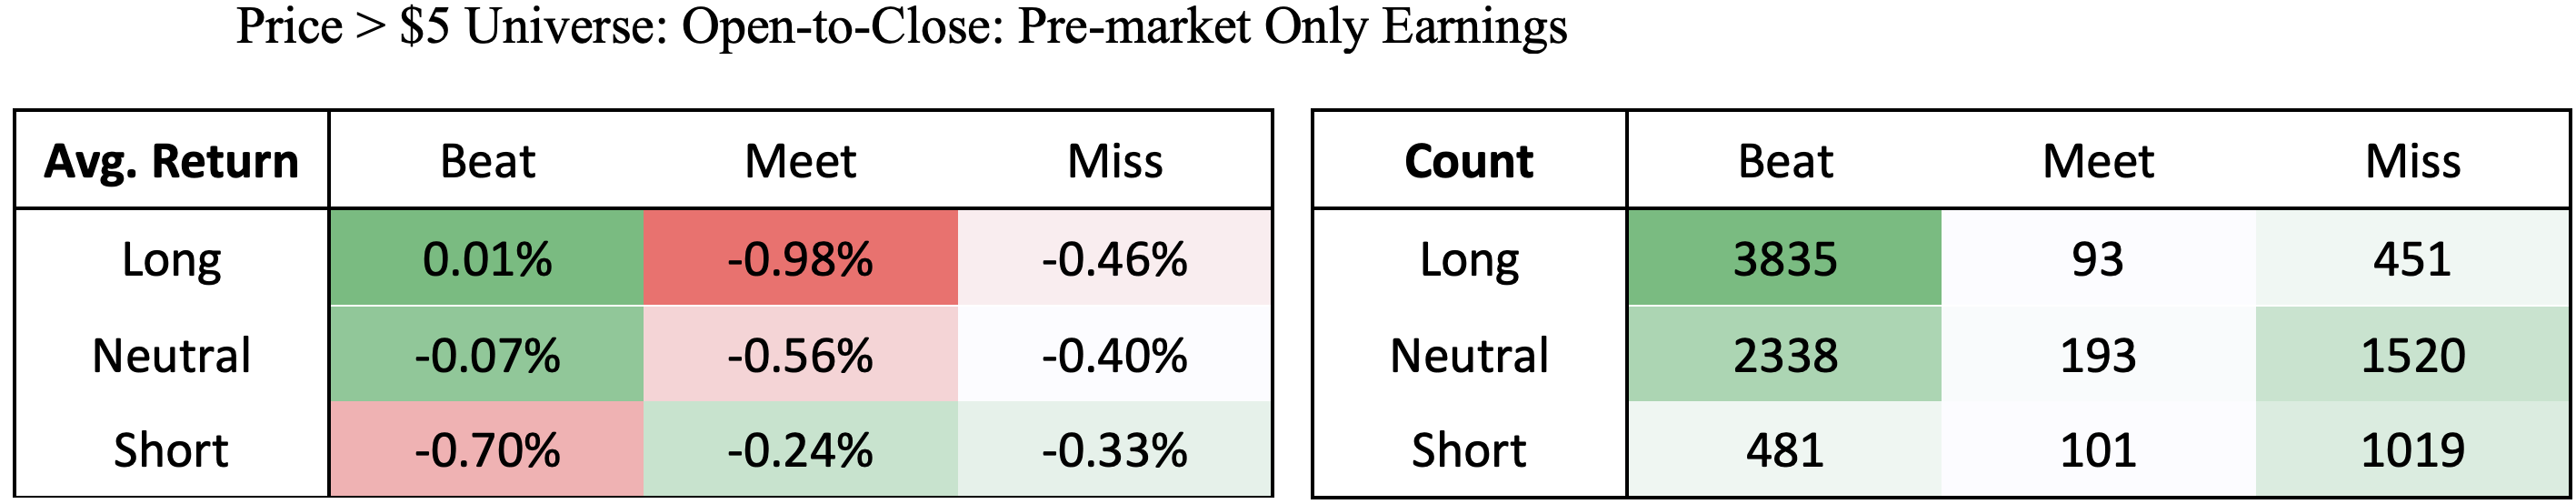
Here we are looking at a subset of the first set of tables above. This universe only includes equities that released earnings this morning, which means there has not been much time between earnings release and the market open. The average return of this table is substantially higher than the average return of the first table.
We next looked at the S-Score pre-earnings release and look at overnight price movements. We take the S-Score at 3:40 pm ET and will execute a trade if earnings are expected to be released after-market-close that day or pre-market-open the next day.
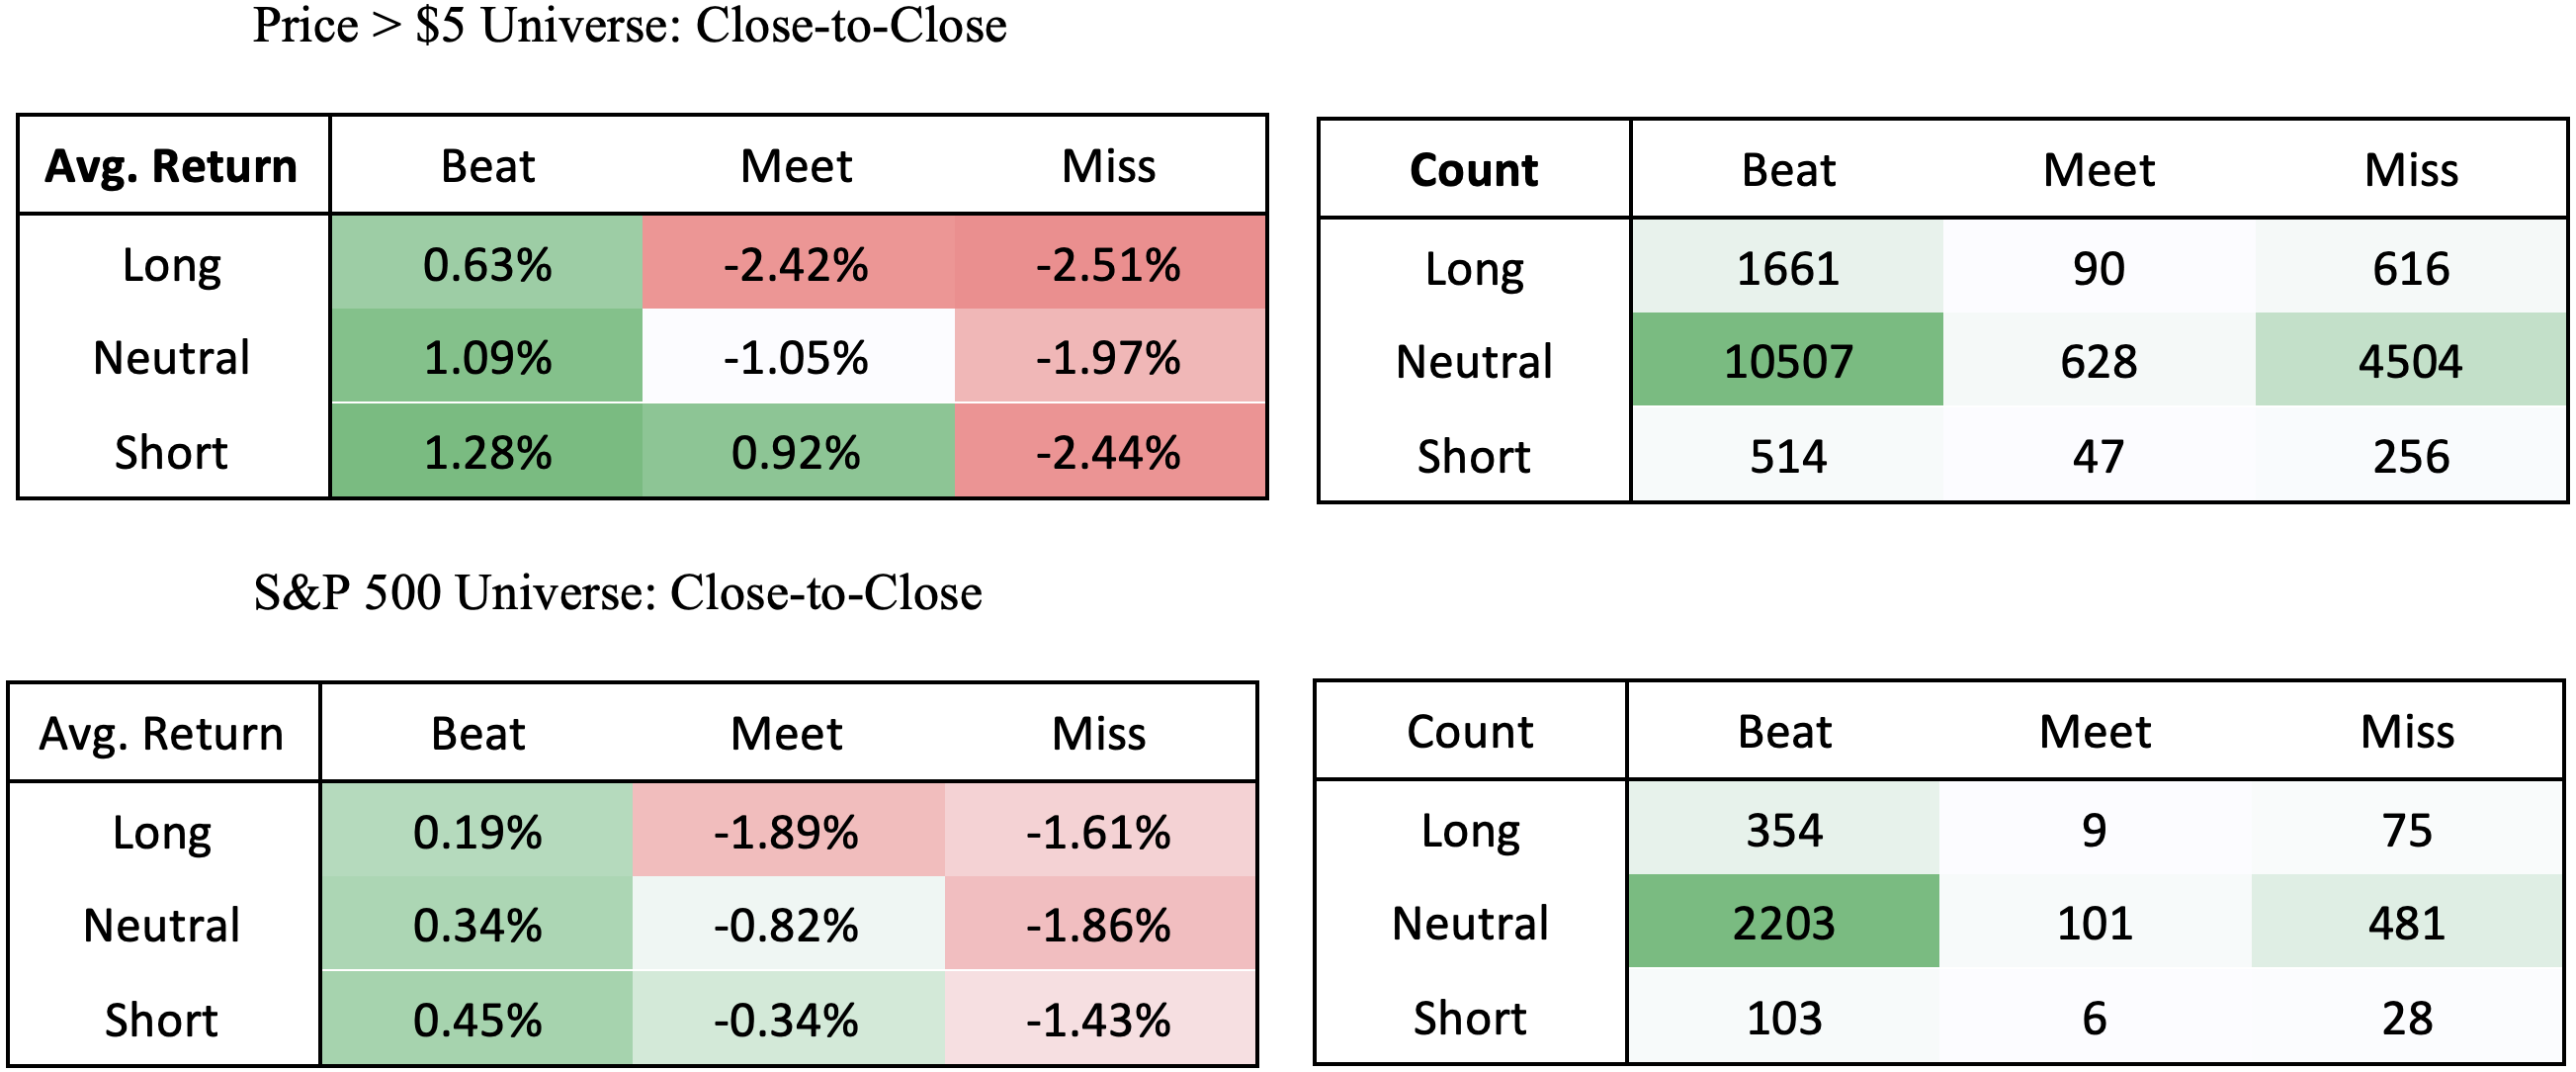
Here are the Close-to-Close returns of an equity that had earnings released during that holding period. We see that the overnight movement goes in the direction of earnings. Price increases when earnings beat and decreases when earnings miss. Securities that have sentiment in the opposite direction of earnings results have the largest swings in price. For example, if sentiment were negative and earnings beat, then returns are expected to be significantly positive because the general consensus (sentiment) was bearish with the results of earnings being unexpected.