The goal of this research project was to aggregate sentiment factors to maximize future stock returns. The factor used for this project was an aggregate of S-Volume, which is the raw number of indicative Tweets in the previous 24 hours by company. Sentiment data is taken from the 3:40 PM ET timestamp (20 minutes before market close). Instead of using the 24-hours Tweet volume, we created a standardized S-Volume metric over the previous 7 days with a 90-day benchmark for each stock. Standardizing volume removes the ‘popular stock’ bias and gives a score relative to their recent trend. Our hypothesis is stocks with a sustained high volume of tweets over previous week (high SV-score) will perform better than those with lower volume. The calculation for the standardized S-Volume metric is shown below, with D representing the date and i representing each stock:
![]()
Stocks selected must have a Close Price greater than $5 the previous day. This eliminates low liquidity and low market cap stocks. Below is the calculation of daily Close-to-Close returns:
![]()
Using SV-score, we created a theoretical Long/Short strategy. The Long portfolio will contain the stocks with the 50 highest SV-scores, and the Short portfolio will contain the stocks with 50 lowest SV-scores. These will be selected each day 20 minutes before market close. The Long/Short portfolio combines the two portfolios to create a portfolio with reduced risk. The benchmark comparison used is the S&P 500 ETF Trust (SPY). Trading with this strategy for the past 10 years gave the following:
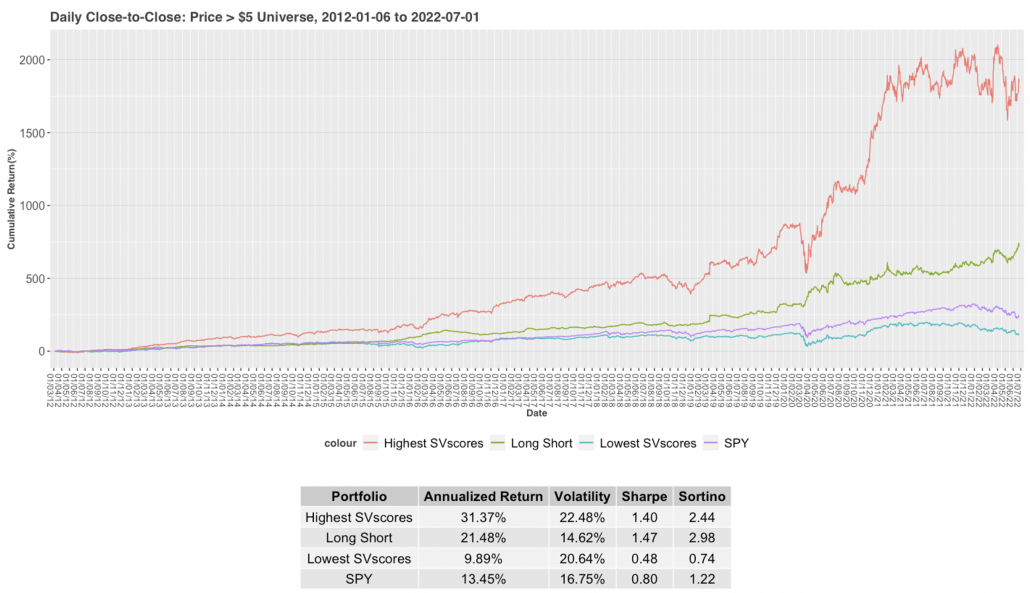
Looking at the graph above, the highest SV-scores consistently and significantly outperform the overall market during the 10-year period. There is a large increase in the Long portfolio during the Covid-19 pandemic recovery. Sharpe and Sortino ratios suggest this Long portfolio is a relatively low risk strategy too. At the same time, the lowest SV-scores performed consistently worse than the market. The Long/Short strategy is the most risk evasive and is still profitable over time. The recent trend with these strategies seemed to be more volatile, so I looked at them since the beginning of the current year:
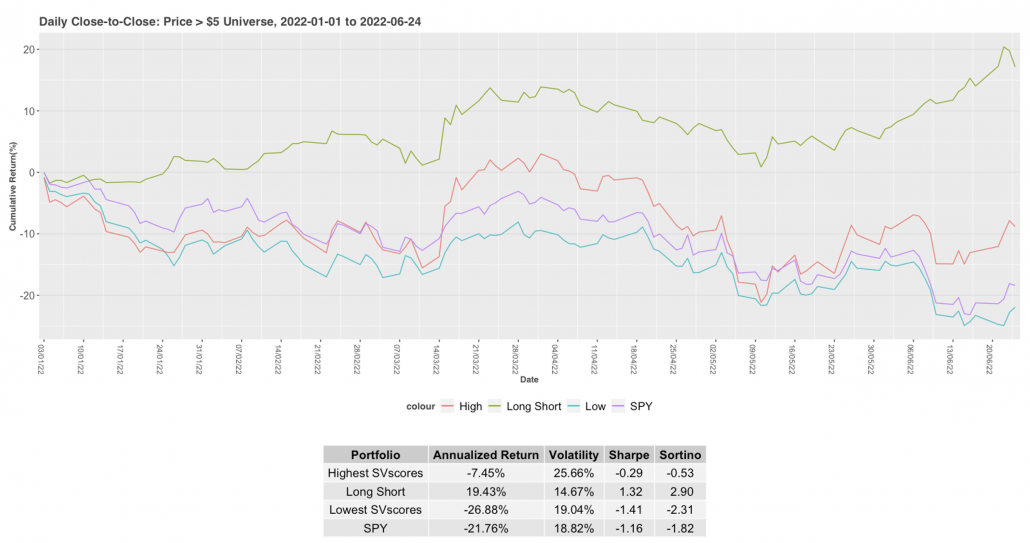
Albeit negative, the highest SV-scores still outperformed the general market while the lowest SV-scores underperformed. Year-to-Date shows the Long Short strategy may be the most effective moving forward as the market has been turbulent. It also maintains the relatively low risk quality as over the 10-year period.
The SV-score measures the volume of indicative tweets surrounding a stock in the previous week compared to its normal amount. A high SV-score, therefore, indicates a stock is a hot topic on Twitter and being discussed frequently. This proves to be a positive regardless of whether sentiment is positive or negative. Conversely, a low SV-score indicates that the stock is being talked about that week less than normal. So, less volume on Twitter proves to have a negative impact on the price of the stock as there isn’t any news worth mentioning. This strategy plays into the idea that ‘There is no such thing as bad publicity’.
If you are interested in learning more about how SMA's S-Factor data can help your trading strategies, please email us at contactus@socialmarketanalytics.com or schedule a demo using this link.