In this brief analysis we discuss how Social Sentiment can enhance stock selection and be used to tilt the weights of S&P 500 Constituents to outperform market benchmarks.
SMA uses our patent NLP to calculate sentiment on each Tweet with fine grain scores ranging from -1.0000 to 1.0000. Negative 1 is extremely negative and positive 1 is extremely positive. We aggregate these values by stock over a 24-hour lookback period. This 24-hour summation of Social Sentiment is called ‘Raw-S’. We use a 7-day summation of Raw-S to calculate a Week-Raw-S for each stock. Popular securities, such as TSLA or AAPL, will have more extreme Raw-S and Week-Raw-S values due to higher Twitter volume. The Week-Raw-S is compared to the mean and standard deviation of the previous 13-weeks’ worth of Week-Raw-S values to calculate a weekly standardized score across all securities. We then take a weighted average of the weekly standardized score over the previous 4 weeks to determine the Monthly Sentiment Score. We take a weighted average of weekly standardized scores, sentiment from Tweets received in the last week have more impact on the Monthly Sentiment Score than Sentiment from Tweets 4 weeks ago.
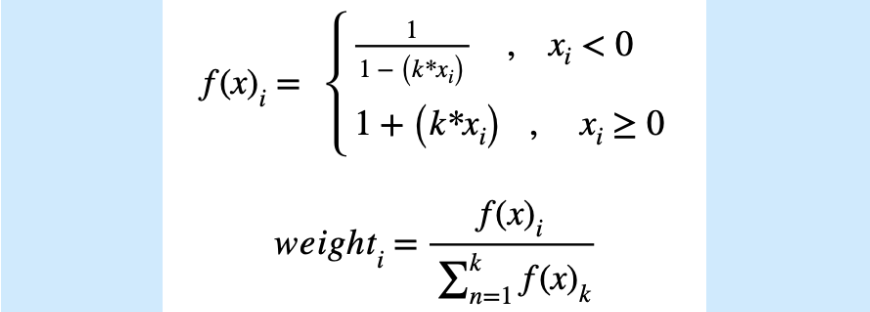
For this theoretical model, we rebalance monthly at the close of the last market day of each month. Constituent weights are determined by the formula below where x is the Monthly Sentiment Score, i is the stock, and k is the number of constituents (500).
We then multiply each stock’s weight by its subsequent monthly price return and sum all returns in that month to calculate the monthly return of the Sentiment enhanced portfolio. Below is the cumulative return series of the SMA portfolio. We use SPY and an equal weighted average of S&P 500 constituents as a baseline.
The Sentiment tilted portfolio outperforms SPY by 13% and the equal weighted portfolio by nearly 20% over a 5-year period. This SMA portfolio also contributes less risk, partially because no stocks are ever weighted too heavily unlike SPY. For instance, SPY’s top 10 holdings account for 28% of the ETF and almost all are in similar industries (AAPL, MSFT, AMZN, GOOG, NVDA). The Sentiment Tilted portfolio’s top 10 holdings on average account for 15.7% of the entire portfolio and are not consistently the largest market cap companies (like AAPL or MSFT). The largest holdings are determined by the Monthly Sentiment Score stemming for SMA’s Social Media data feed.