Every quarter we review performance returns and statistical ratios for our family of S-Factors. S-Score is a normalized representation of sentiment over a pre-defined look back period and is a key metric. Below are some charts that look at the full history and YTD performance of our data across the entire universe.
Anyone can pick specific securities and instances where sentiment leads price movement; it’s a lot harder to consistently predict movements over the entire universe over a long period of time. We pride ourselves on statistical consistency of our data over what is now 3.5 years of history. We are the only company to track and publish these metrics, providing the most transparency.
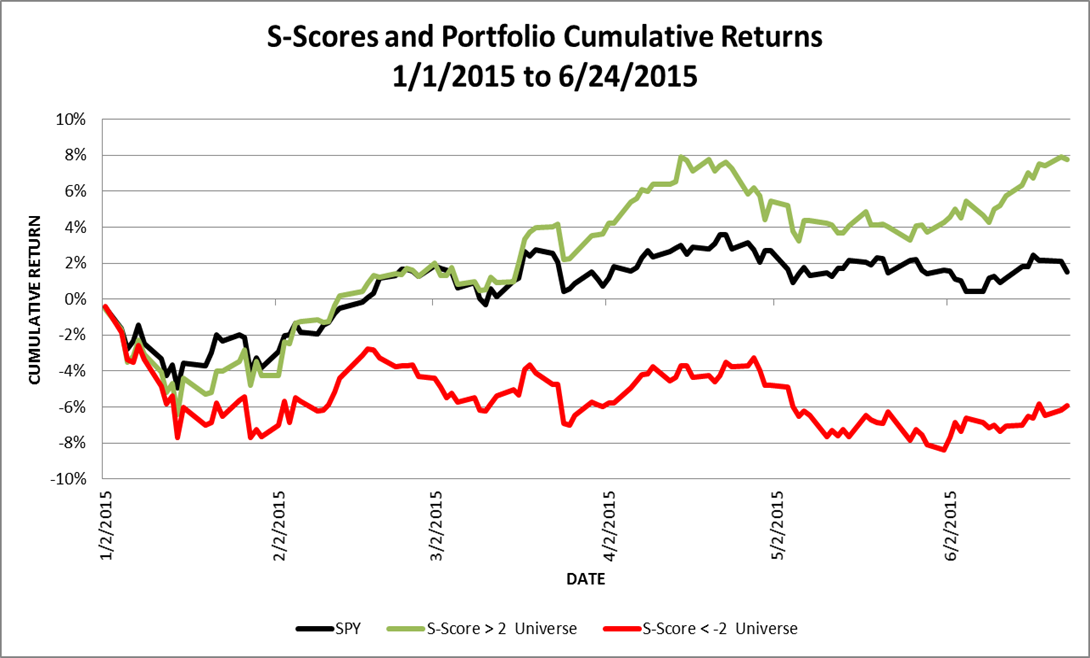
We view S-Score >2 and S-Score <-2 as statistically significant. An S-score of 2 means the current conversation on social media is more positive than 97 percent of prior conversations as filtered by our proprietary metrics. When this happens the security moves higher with statistically significant consistency. The green line below represents the full history cumulative open to close return chart of stocks with a high S-Score (S-Score >2) prior to market open. The Red line represents the full history cumulative open to close return of stocks with an extreme negative S-Score (S-Score <-2) prior to market open. The black line represents the open to close return of stocks in the SP500. The Sharpe and Sortino ratios for the green line (Pre-Open S-Score >2) are 1.37 and 2.23 respectively. Sharpe and Sortino ratios for the red line (Pre-Open S-Score <-2) are -.54 and -.86. Benchmark SP500 Sharpe = .69 and Sortino = 1.08.

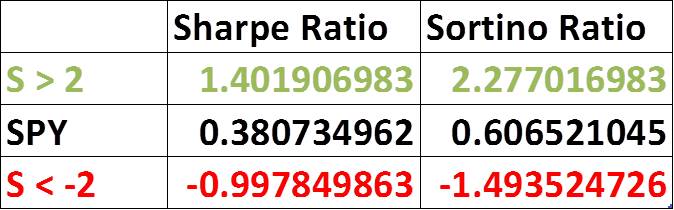
Below is the exact same chart for YTD 2015. Sharpe and Sortino ratios show the benefit of our evolving filtering and scoring criteria.
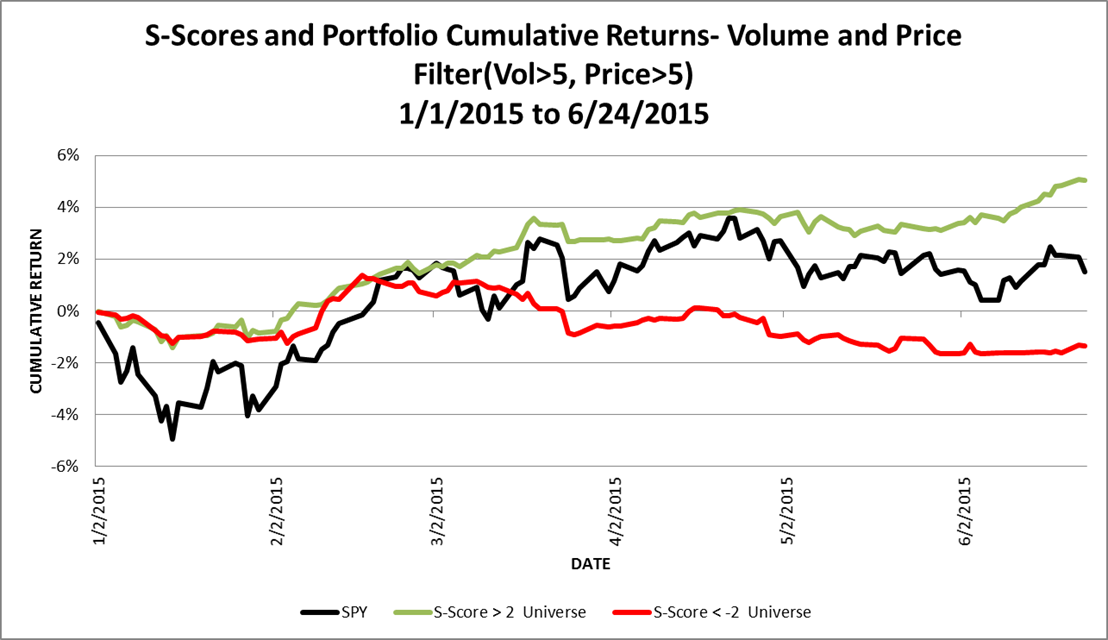
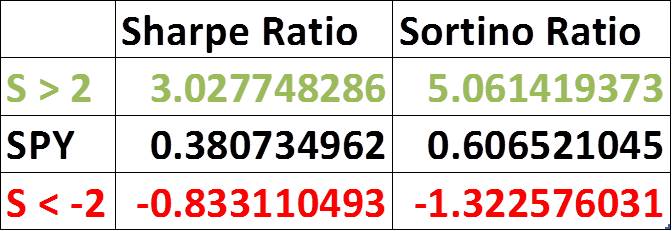
Price and Tweet volume filters are commonly added when filtering stocks for sentiment. Tweet volume represents indicative Tweet volume, once all Tweets are filtered indicative volume typically represents only 10% of the total volume of Tweets. The below chart is the same return chart represented above with the added filter of Price day close price >5 and indicative Tweet volume > 5. As you can see the Sharpe and Sortino ratios increase dramatically by adding simple filters.
Social media analytics is a learning process. Our filtering and cleansing algorithms are continuously evolving. We maintain our history as it was at each time and we keep dictionaries and accounts as a time series.
We have many more statistics employing other S-Factors and filtering criteria; please contact us for a more detailed briefing on SMA data and products.
Thanks,
Joe