Two weeks ago the Deutsche Bank Quantitative Research Team released a full research report exclusively on Social Market Analytics sentiment data. This excellent report independently verifies the predictive nature of the Social Market Analytics Sentiment factors. All data and charts for this blog are taken from the Signal Processing – Social Media Sentiment Report written by the Deutsche Bank Quantitative Research Team. Over the coming weeks I will be blogging about different sections of the 35-page research report. The full report contains much more detail than I will explore here. Reach out to me for more information.
After the introduction, there are three main sections: S and S-Score alone and with various technical indicator overlays, a monthly holding period range based strategy and a social media use in predicting security behavior after corporate events section. Some iterations have Sharpe Ratios well over 2.0.
This blog will explore the close to close subsequent return of a quintile portfolio based on the Social Market Analytics S-Score Factor and expand the analysis to include technical trading strategies applied to the S-Score Factor. No attempt was made to apply multiple S-Factors to the strategy, which is a good idea for further research. S-Scores are taken pre-market close and executions are assumed to be market-on-close. The below table shows a quintile portfolios created based on S-Scores for a universe of Russell 3000 stocks returns a Sharpe ratio of 2.4. The returns are monotonic in nature. The signal decays over a longer period-of-time with correlations between factor scores and returns out to ten days.
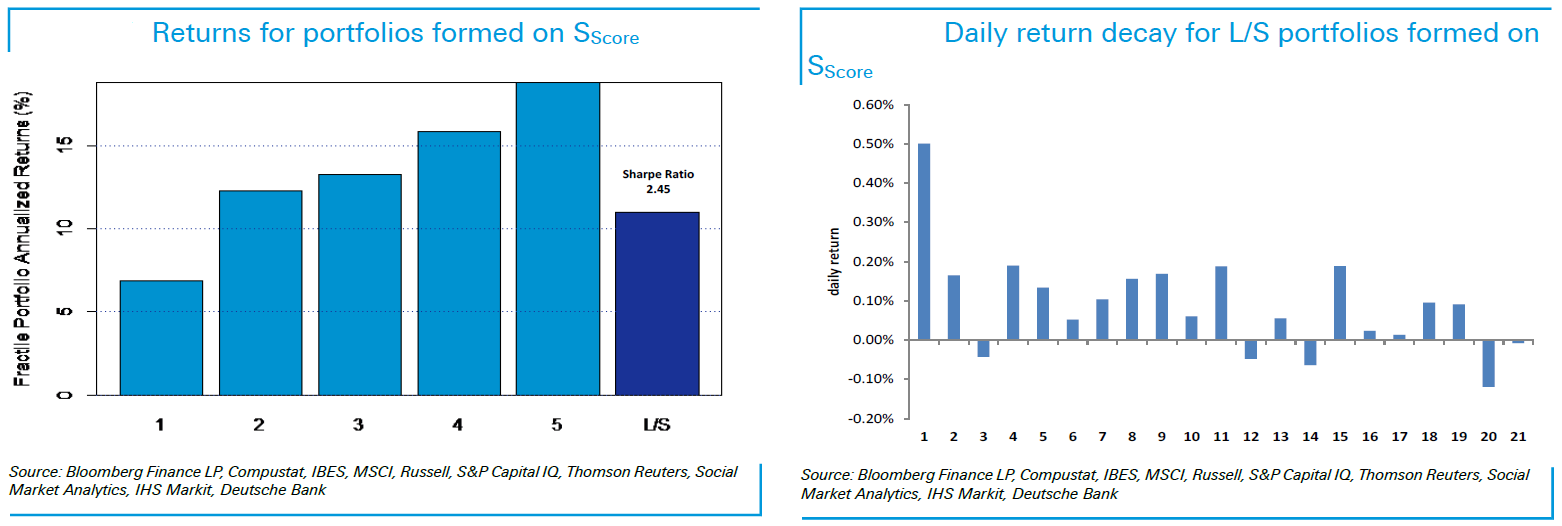
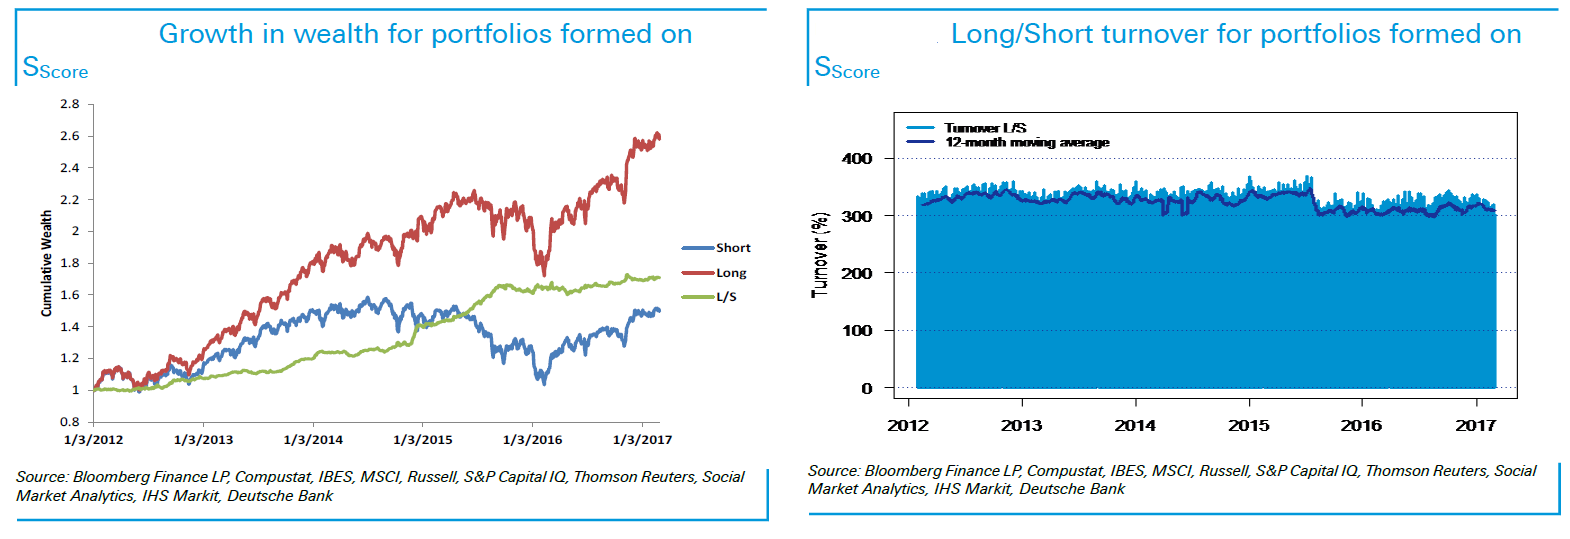
The below charts illustrate the growth of the long, short, and long/short portfolios. Turnover of these portfolios is relatively high as illustrated by the turnover table.
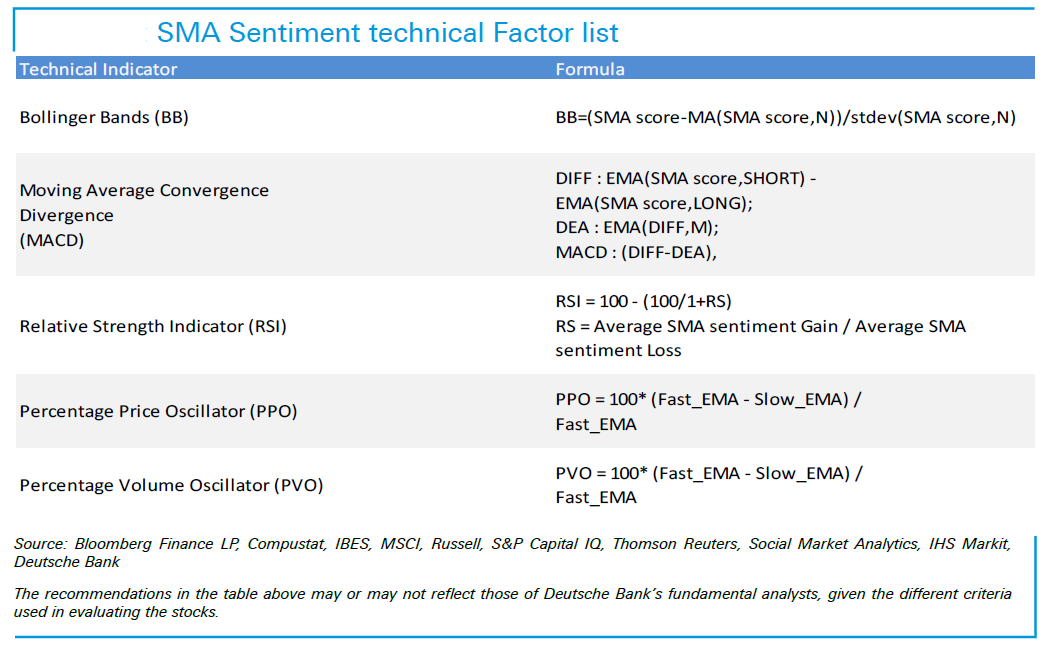
To refine the strategy, DB examined ways to improve the risk adjusted returns and lower turnover. Traditional technical indicators were applied to the S-Score derived factors. The below table illustrates the technical indicators applied to S-Score data with subsequent returns and turnover.
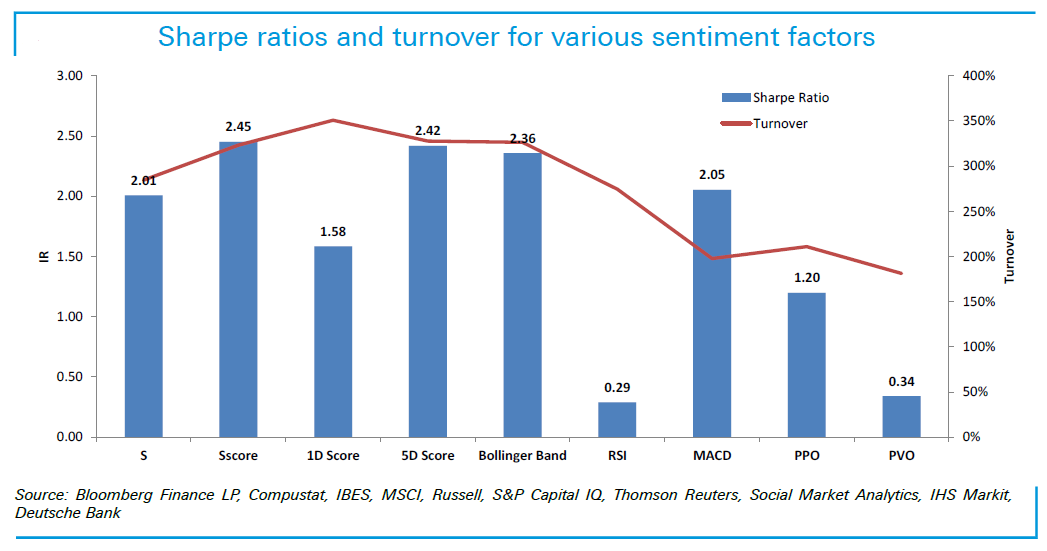
Sharpe Ratios and turnover are illustrated in the table below. Bollinger Band, MACD, and 5D Score all have Sharpe Ratios above 2. Turnover for MACD decreased significantly when compared to the S-Score portfolio.
S-Score was used to derive these signals. Social Market Analytics has 7 primary factors and 19 total factors in our feed. Reach out to us to explore our data for implementation into your trading systems. The next blog will explore monthly holding period long-short portfolios explored in the DB paper and some follow up Social Market Analytics derived research.
Stay tuned and reach out to me with any questions: info@SocialMarketAnalytics.com