As we move towards the fourth quarter people have been asking how SMA data is performing in this volatile market. Those who have been following us over the years have come to expect the Open to Close (O-C) Chart to illustrate the performance of our data. We have been publishing this chart since the launch of the company in early 2012. The machine learning applied to our NLP has provided increasing predictive power to our data as our out-of-sample training set continues to grow. Even as we increased our asset class and security coverage. Twitter has continued to be the go-to source for breaking news and conversation. This rich and growing source of communication has allowed us to continue to improve our data.
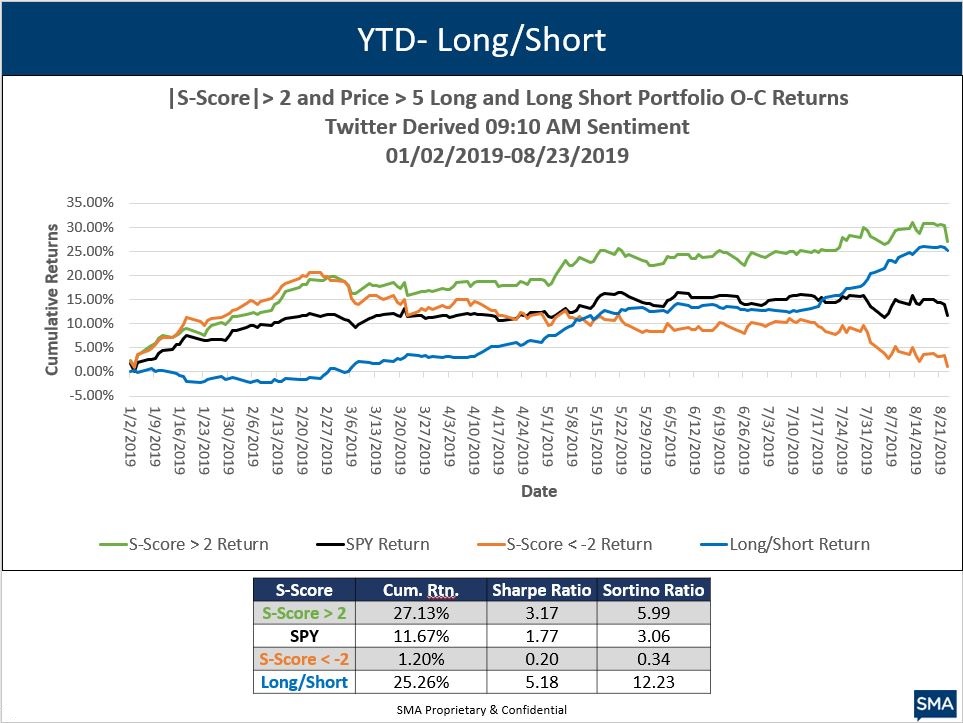
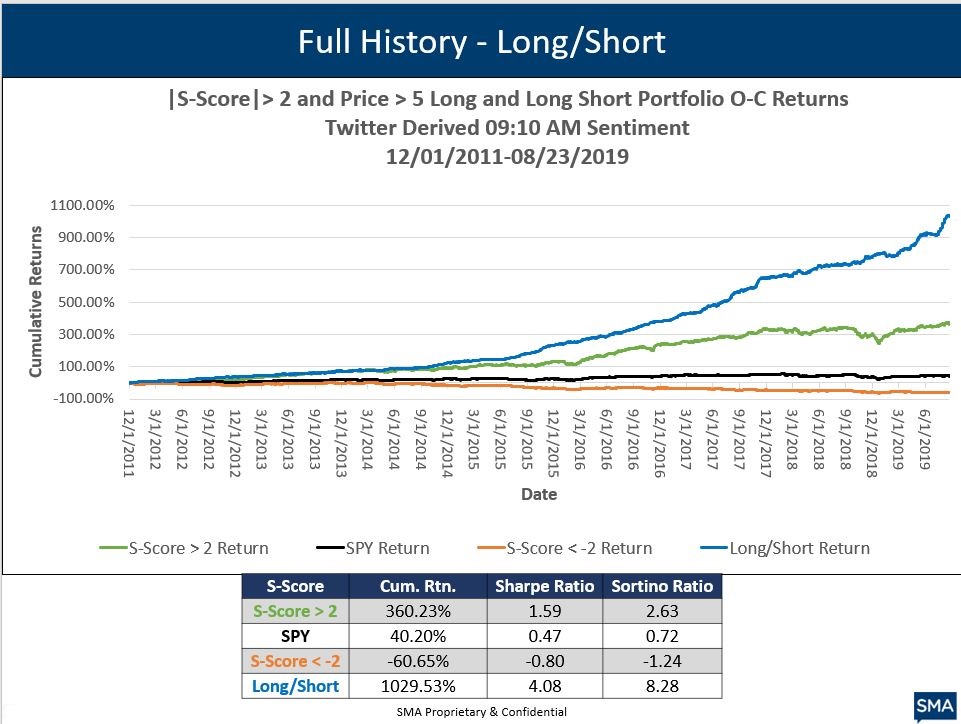
The below charts illustrate the standard subsequent O-C performance of securities with |S-Score| > 2, 20 minutes prior to open. As you can see even with a volatile market the Open to Close performance significantly outperforms on the long and short sides over the last year and the full history continues to perform well. YTD the long-short portfolio has a cumulative return of 25.26% with a 5.18 Sharpe Ratio. This is primarily driven by the long side. Securities with an S-Score < -2 returned 1.20% - significantly underperforming the benchmark S&P. This chart is updated through Friday 8/23 to illustrate performance during a large market down day.
Full history is below. This chart illustrates the Machine Learning component of our data. As more data is added to the out-of-sample historical set the training become more effective.
 To learn more about our data please contact ContactUs@SocialMarketAnalytics.com.
Thanks,
Joe