Social Market Analytics (SMA) has created the Global Machine Readable Filings (GMRF) dataset in partnership with S&P Global Market Intelligence. GMRF provides parsed textual data broken down to sections along with metrics like word count and sentiment on annual and interim reports for companies around the world. Extraneous information such as images, tables, and page numbers are removed for textual analysis purposes.
In this blog we began investigating word count and sentiment metrics related to Annual Reports (AR) in the GMRF dataset. Each document is linked with a company and each company can be linked to multiple securities. These securities could be different class shares on the same exchange, or the same company listed on multiple global exchanges.
Since these reports only come out once a year, there will only be one value of factors per company each year. To construct a calendar-time portfolio, metrics from the most recent Annual Report for each company is extended up to 12 months. Quintile portfolios are constructed at the end of each month based on values of the most recent factors from a company’s Annual Report. In our analysis below, Quintile 1 contains 20% of stocks with the lowest value of the factor. Quintile 5 contains the 20% of stocks with the highest value of the factor.
For time-series purposes and to avoid look-ahead bias, in this analysis we assume that Annual Reports are released publicly 90 days after the fiscal year end date for that company. For example, if a file had a fiscal year end date on 12/31/2011 the word count and sentiment factors associated with that Annual Report would be implemented into the quintile portfolios on 3/31/2012.
After cleaning the dataset by removing documents with low word count, extreme changes in word count, and filings within four months of each other, we map the documents to the securities’ monthly return. Stocks are placed in quintiles based on factor values. Returns are equally weighted within each quintile.
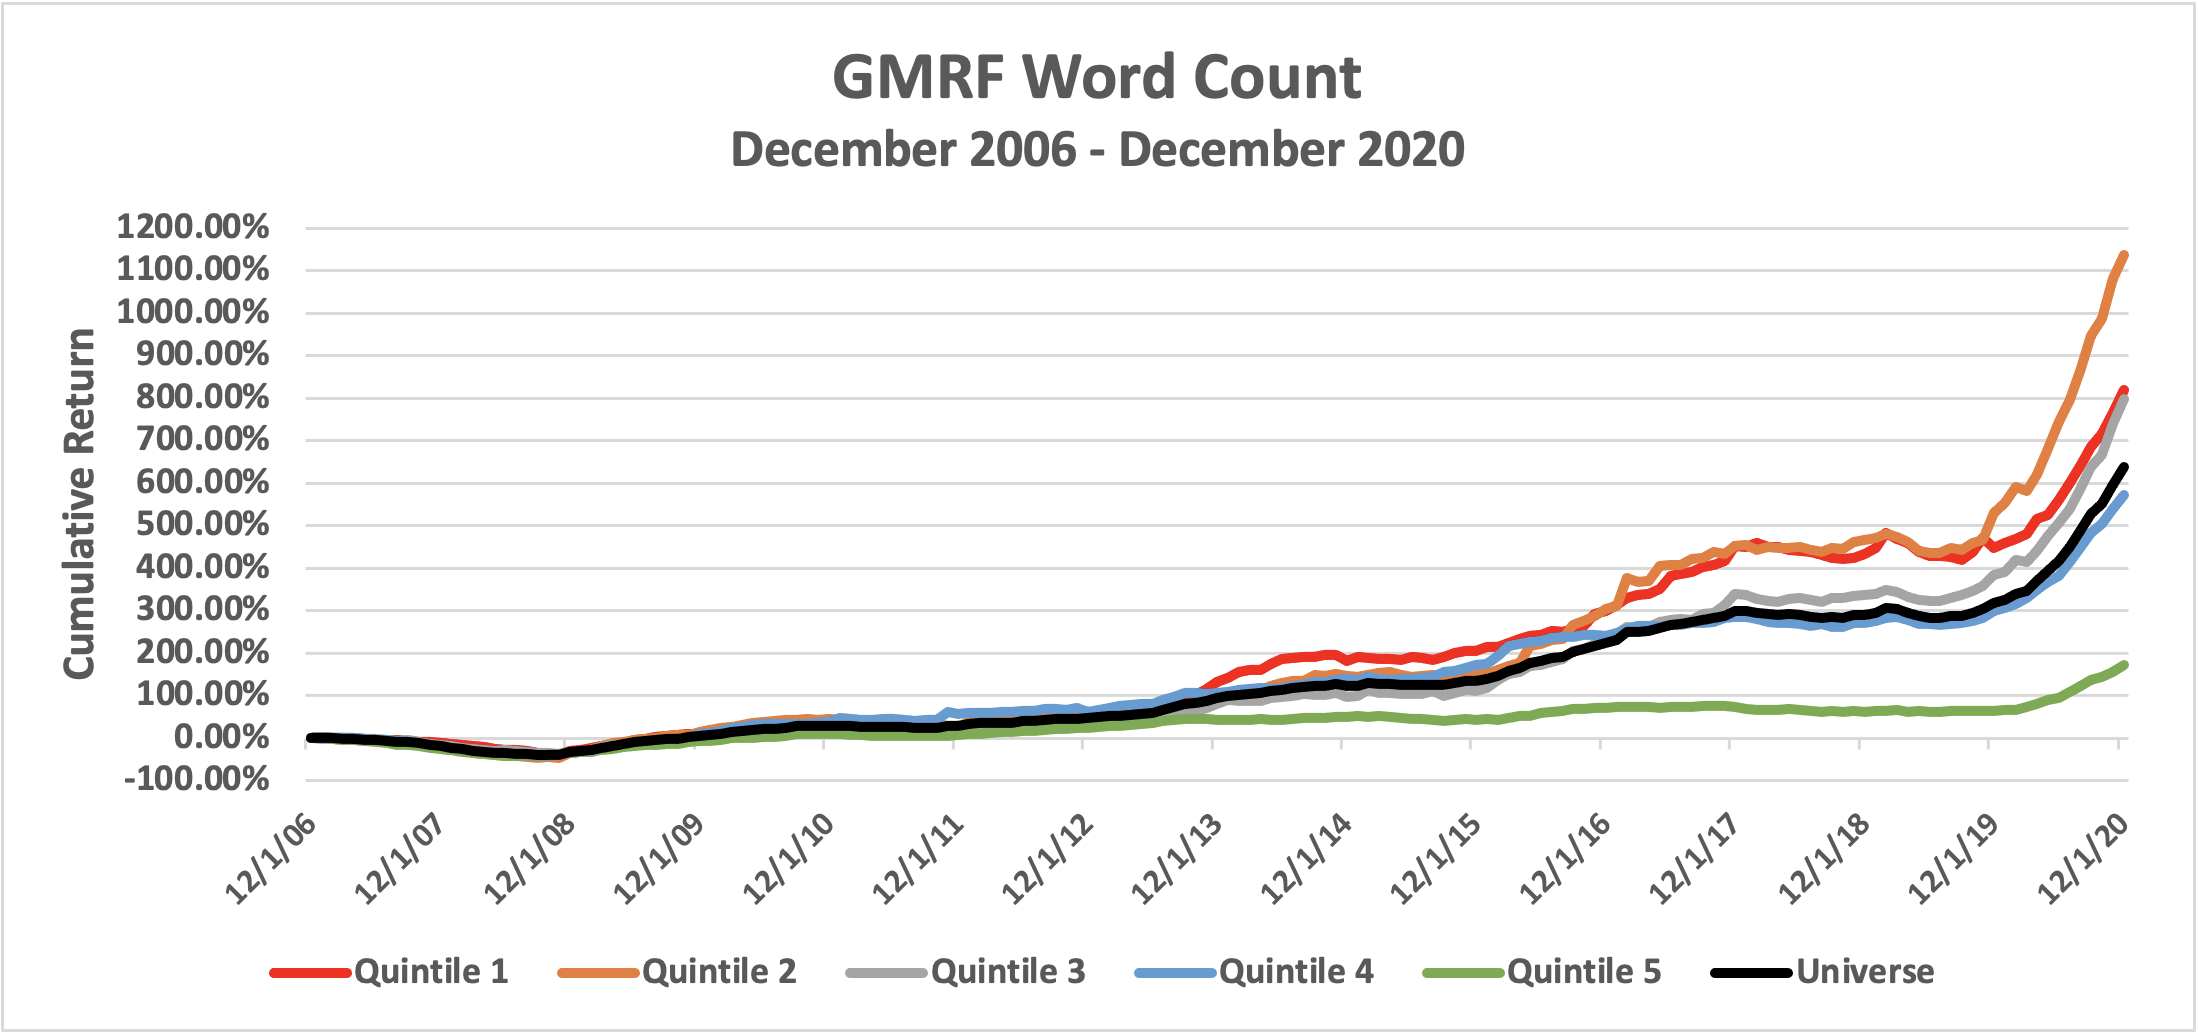
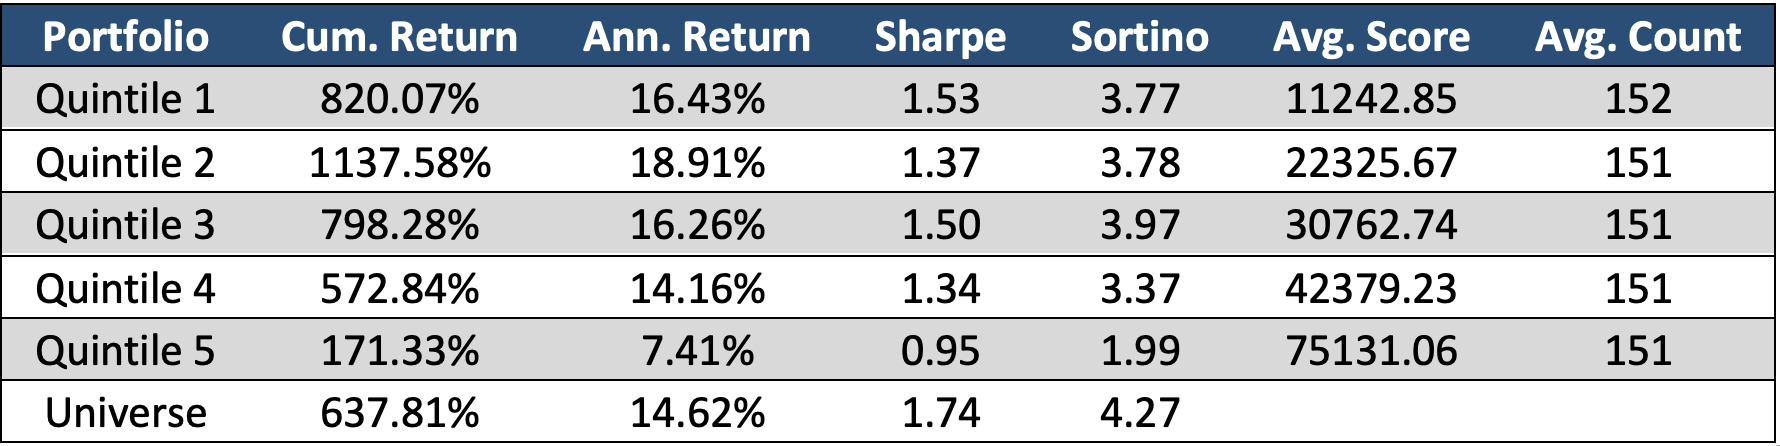
This chart illustrates the relationship between the length of Annual Reports and future price returns. Higher word count in an Annual Report indicates the company has more information to supply to investors. Quintiles 1 and 2 outperform the universe of stocks in the dataset while Quintile 5 severely underperforms. Quintile 5 contains companies that have produced extremely long Annual Reports over the past 14 years. Long Annual Reports typically contain unnecessary language or ‘fluff’ to ease concerns of investors and portray the company in a stable fashion. This text could be information addressing specific risks and business actions or could be new information on products and legal proceedings. The theory is shorter Annual Reports are more forthright with information regarding business affecting the company’s stock. This is consistent with the classic Harvard Lazy Prices1 paper findings.
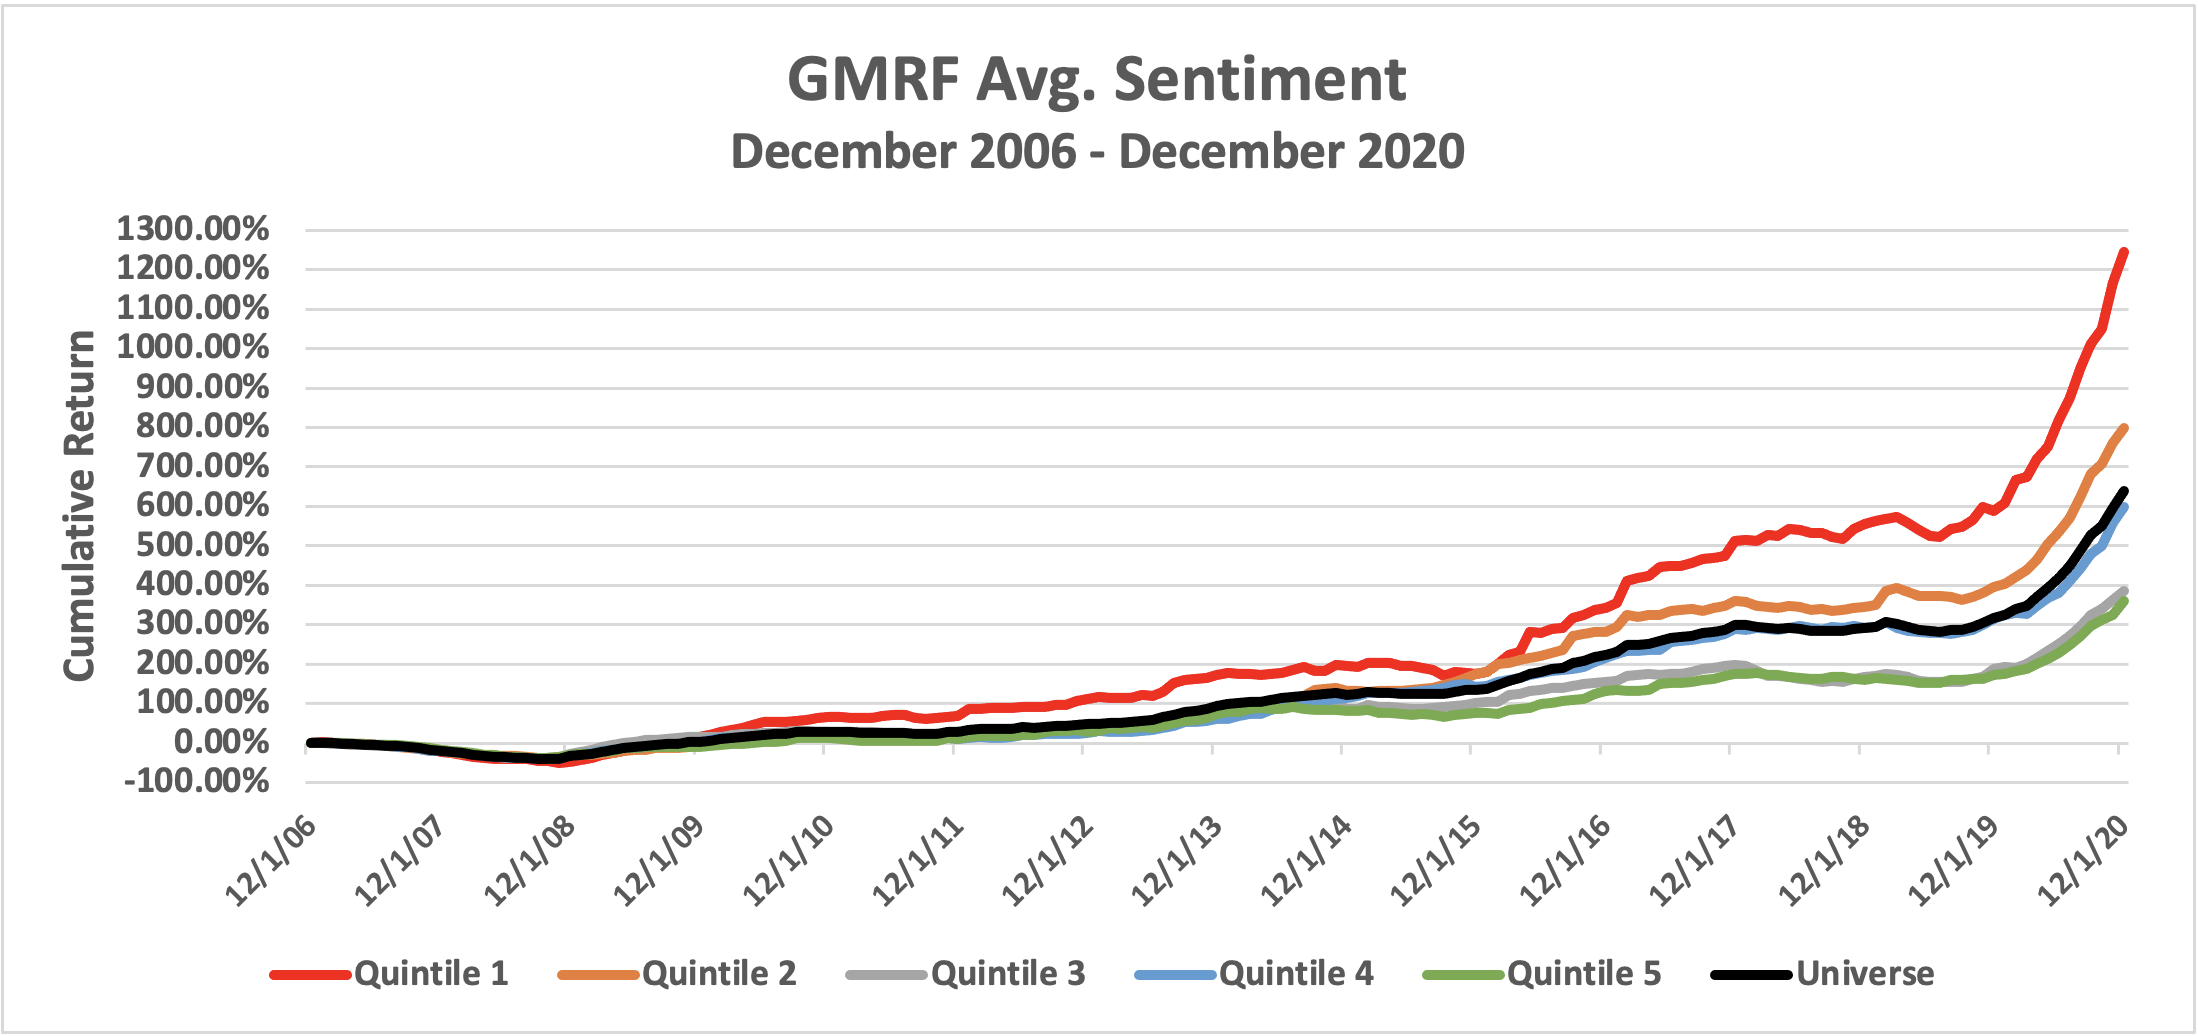
Next, we look at the Average Sentiment across an entire Annual Report. Average Sentiment is calculated by taking the mean of sentiment from each Part within an annual report. Each Part is a level one header, or the overarching categories in a Table of Contents. The sentiment of each Part is calculated by taking the sum of each sentence within each Part. Thus, Parts with more textual data (more sentences) can have a higher magnitude of sentiment. A Total Document’s Average Sentiment is slightly correlated to the documents word count.
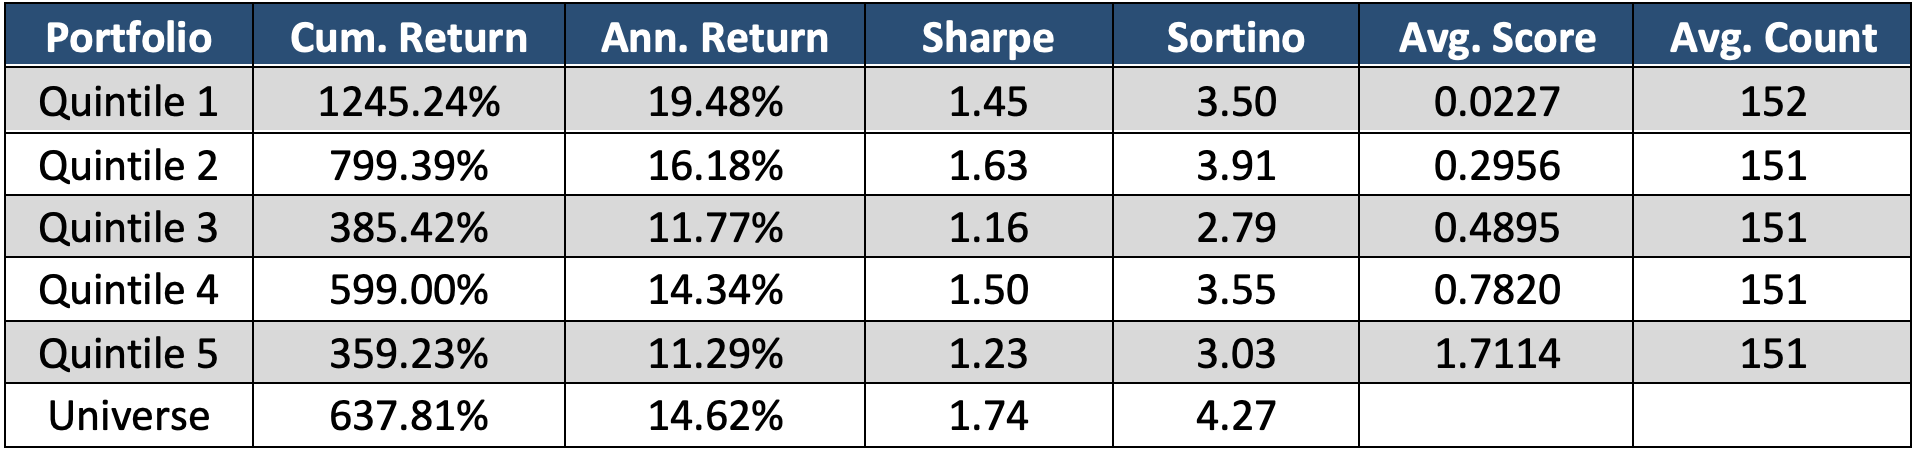
Here we see an inverse relationship between a document’s word count and price returns. A low Average Sentiment outperforms the rest of the universe while high Average Sentiment underperforms. This can be traced to the company’s transparency with its investors. Theory is Annual Reports that state the company’s proceedings and risks, with no sugarcoating, tend to have a lower Average Sentiment in Annual Reports.
This analysis are preliminary findings on the GMRF dataset. SMA will explore further on how characteristics of Annual Reports can affect future stock prices by sector and region. To trial this product or learn more about other Social Market Analytics datasets please email us at ContactUs@SocialMarketAnalytics.com