Earnings performance and indicators are one of the most looked at metrics within the finance community when choosing to invest in a security. Paired with earnings announcements are a conference calls where management comments on the company’s performance in a prepared statement. Afterwards investors can ask questions about specific components of the company and its outlook. This section is where you can gauge the finance community’s thoughts on a security based on the tone of conversation and the language used.
SMA converts Earnings Call Transcripts to JSON format and applies proprietary sentiment metrics. We calculate sentiment, word count, and section metrics from the Q&A section of the Earnings Call Transcripts to see relationships with subsequent price returns.
Since Earnings Calls typically occur 4 times in a calendar year for each company, this analysis uses quarterly holding periods. Portfolios are determined by the value of sentiment and word count metrics associated with the company’s Earnings Call Q&A section. At the end of each month, we look at any new Earnings Call Transcripts submitted in the past month and rebalance the portfolios. Sentiment and word count values can be held for a company for up to 4 months or until a new Earnings Call occurs. Portfolios are quintiles with Quintile 5 being the highest 20% of the metric and Quintile 1 being the lowest 20%. Each portfolio is rebalanced at market close of the last trading day of each month. Securities must have a Price > $5 to be included in the portfolio to remove volatility in returns from penny stocks.
The first metric is Sum Sentiment. SMA looks at every word and phrase for sentiment and has a score when identified. We take the total sum of all the sentiment from the words and phrases in the Q&A section. We expect companies that have a higher Sum Sentiment to outperform the market while companies with lower Sum Sentiment underperform.
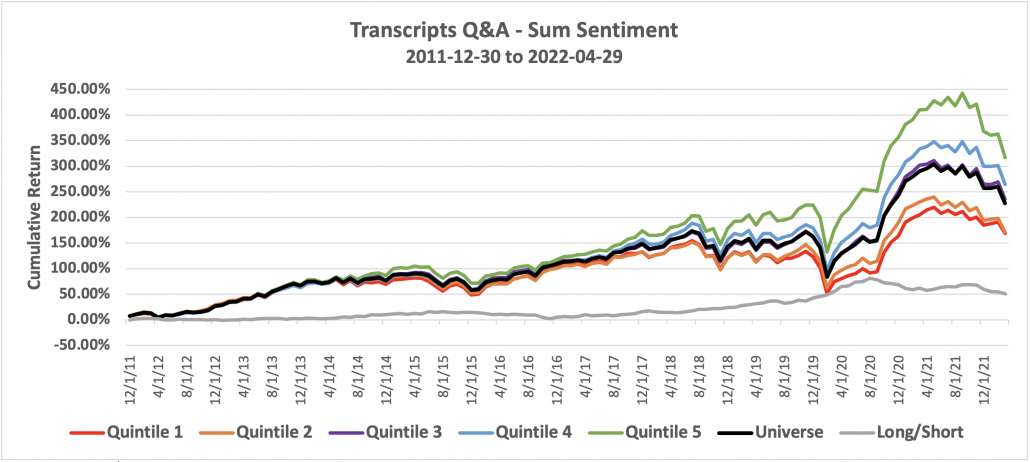
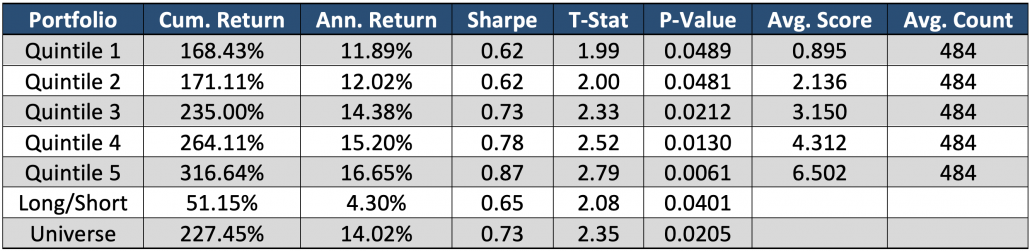
Sum Sentiment quintiles performed as expected. There is a monotonic signal showing companies with high Sum Sentiment in the Q&A section of their Earnings Call are more likely to exceed market expectations. On the other side, companies with low Sum Sentiment underperform. The tone, or sentiment, of investors questions as well as the response from management, projects how people feel about the future of the company which affects the security’s future price returns.
A theoretical Long/Short between Quintile 5 and Quintile 1 has a steady increase over time with not much drawdown. This theoretical Long/Short portfolio passes a significance test at a 5% level. Each Quintile has on average 484 securities, which comes to an average of 2,420 securities rebalanced each month.
Next, we look at Hits per Word. Hit Count is the number of words or phrases tagged with a sentiment score and word count is the total number of words in the Q&A section. We take Hit Count divided by Word Count to get hits per word. This metric is the percentage of the document scored with sentiment. This is helpful in identifying which companies discuss relevant components and crucial to the firm’s outlook, rather than blathering about unrelated or unnecessary topics.
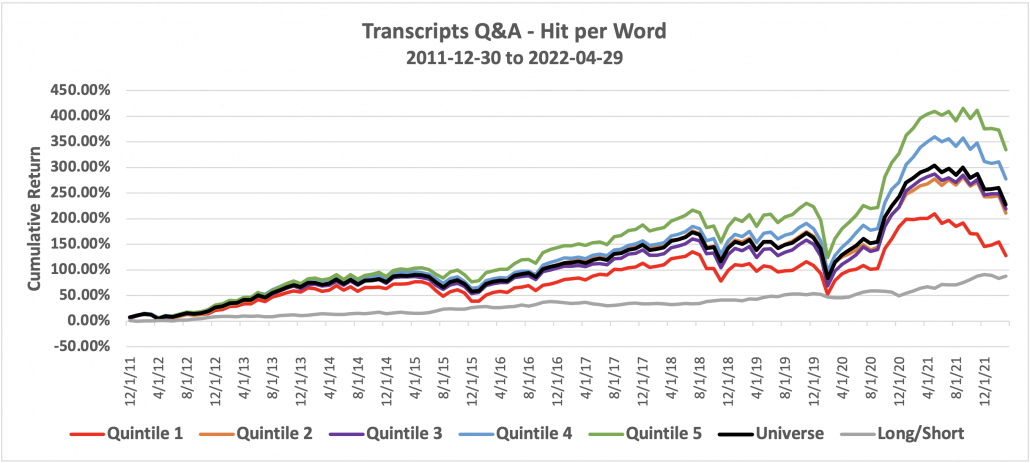
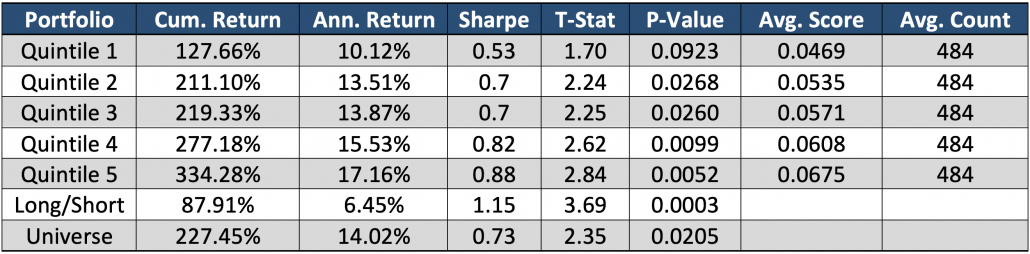
The monotonic nature of this graph demonstrates the predictive power of this factor. Companies that have a higher percentage of words/phrases with sentiment in their document tend to outperform the market. These firms are letting investors know insightful information rather than boilerplate responses. Investors respond positively to truthful management insights and respond negatively to Earnings Calls where management doesn’t convey the company’s vision.
The Questions and Answers section of an Earnings Call contains crucial information that typically isn’t being quantified. With SMA’s new Earnings Call Transcripts product, these calls now have quantitative metrics to its qualitative insights. This information can now be tapped to project companies price returns with an investment horizon of multiple months. The analysis above doesn’t even account for the alpha immediately after the earnings release because trades are executed at market close of the last trading day of each month. That means there could be 20+ days of alpha from the new Earnings Call to when the strategy acts on that information. This conservative approach still exemplifies the importance of these factors to the finance community.
If you are interested in learning more about how SMA’s Earnings data can help your trading strategies, please email us at contactus@socialmarketanalytics.com or schedule a demo using this link.